Investment Summary
Regulated, capital-intensive businesses typically hold large investments in long-lived, tangible assets (including their inventories). Often, these assets are partially funded with long-term debt, and returns on equity are subject to whatever leverage these corporations can employ.
The construction machinery and heavy transportation equipment industry is one such domain. The commodity-like economics of the industry means 1) operating margins are thin for most players, 2) those with higher capital efficiency win the race, such that 3) it is the lost-cost provider which often draws customer attention.
For the business producing a high ratio of sales on capital invested into their business, growth in operating margin will drive the greatest change in corporate value. The issue is all its competitors are likely trying the same thing. So, for a low cost-provider who suddenly recognizes a large increase in operating margins, it tells me one thing – consumer advantages.
In times of high pricing, tight capacity, and economic turbulence, customers will turn to the ‘low-cost provider,’ increasing this gap.
This is the consumer advantage, I believe, is present for REV Group (NYSE:REVG) at the current point in time.
Incorporated in 2008, REVG is in the specialty vehicles business. The company operates via two segments, Specialty vehicles (“SV”), and Recreational vehicles (“RV”). The SV business provides customization on vehicles used for essential services and commercial infrastructure, such as Fire, Ambulance, Public Transport and so forth; RV for leisure. Notably, a handful of the company’s portfolio brands have been in operation for longer than 50 years.
In 2014, REVG did $1.72 billion in top line sales on earnings of $1.5 million. By 2018, this had increased to $2.38 billion, with net income of $13 million. In 2023, it grew sales ~$300 million year-on-year to $2.63 billion, on earnings of $241.5 million. In other words, since 2014, sales have grown at a compounding rate of 4.8%, whereas earnings have grown by 76% per year on average in the last decade.
Management growth plans
REVG is exiting the bus manufacturing business via the recent sale of its Collins Bus business for $308 million. Management subsequently returned $179 million of this as a $3.00 per share special dividend paid in February, and repurchased 8 million of its common stock, reducing the outstanding float by 13%. I am a huge fan of this – increasing our ownership stake in a quality company without us having to outlay any additional capital. Thank you, management.
This also reduced ownership concentration too – the largest shareholders now own c.18% of the company, vs. 46% previously. In addition, it will also wind down operations in its transit bus business.
Management remains committed to three avenues in capital allocation:
-
Returning capital to shareholders ($400 million returned since 2020, 29.2% of current market cap),
-
Paying down debt,
-
Producing high levels of operating cash flows to “pursue new growth opportunities”, per the Q1 2024 earnings call.
REVG did $586 million of business in Q1 2024, flat on the prior year. Growth was clamped due to slower outflow of Class A and B units, and towable units. It pulled this to adj. EBITDA of $30.5 million, up 43% year-on-year.
The divisional breakdown on this is as follows:
-
SV division: Produced $417 million top line sales, up 17% year-on-year, driven by 24% growth in fire + 23% growth in ambulance. Adjusted EBITDA was $26.2 million, with segment backlog of $3.9 billion (up 22% year-on-year). The book-to-bill ratio of 1.3x is a good sign.
-
RV segment: Did $169 million of business, down 25% year-on-year as demand cools. For instance, unit shipments were down ~40% year-on-year, with towable unit shipments compressing 80%. It clipped adj. EBITDA of $11.6 million on this, down 52%. The book-to-bill ratio was 1.2x, indicating there is a floor on demand in my view.
Management now guides to $2.55 billion in revenues for 2024. It expects continued pull through from the fire and ambulance divisions against headwinds in its recreational vehicles business. Consensus estimates 5.5% decline in sales this year, returning to a steady 4-5% growth the year after. However, Wall Street also envisions strong earnings growth of 8% and 40% in the next two years, respectively. Management also expects to invest around $30-$35 million of capital expenditures toward growth initiatives and maintenance upgrades by the end of 2024.
Figure 1.
BIG Investments, Company filings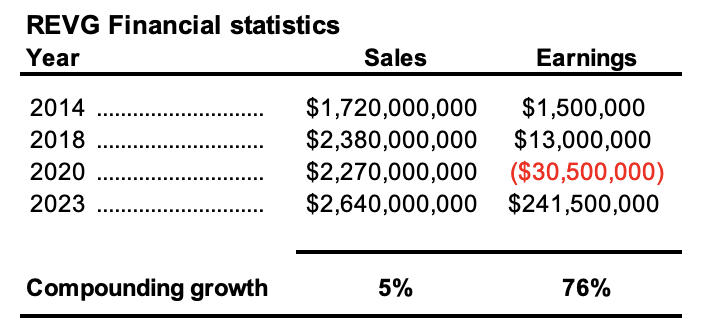
On examination, REVG has attractive economics for the intelligent investor in my estimation. REVG is a high-volume, low profit margin name, operating with exceptional capital efficiency. This point is tremendously important, given capital produces the profits for this company.
Here I will demonstrate our findings on REVG and explain why I think it is a buy on grounds of 1) fundamentals, 2) valuation, and 3) sentiment. Net-net, rate buy.
Downside risks
The following risks must be well understood by investors before proceeding further:
- You will note the thesis is built on the company’s potential growth in operating margin. If this doesn’t materialise (or goes backward), this could nullify the thesis.
- Investors are wise to check current S&P 500 index level valuations, which are currently high. Goldman Sachs projects a level of c.5,200, around where we trade today. This could be neutral for equities.
- In addition, the company’s U.S. revenue base could be impacted if there is a recession here. I would caution investors to pay very close attention to the economic data guiding GDP growth estimates (inflation, rates, employment, and so forth) as guiding principles on this.
- More specific recommendations around position sizing and risk management in these times include (i) committing lower percentages of net worth to each new position, (ii) taking profits earlier than usual, and (iii) buying securities with a wide margin of safety on valuation. Although REVG fits the bill here, investors are wise to consider these points moving forward.
Industry outlook
There are numerous tailwinds for the construction machinery & heavy transportation equipment market in the next decade. It is projected to grow at a compounding growth rate of 4.8% and reach a value of $252 billion by 2028. Increasing investments in infrastructure and large public capital works have driven global demand for construction and heavy construction equipment higher.
Mining is also another key tailwind, with numerous government programs supporting the exploration and production of critical minerals for the energy transition. This includes sub-sectors such as rare earths, lithium, copper, and so forth. Furthermore, urbanization is driving this trend, with around 68% of the world’s population expected to be residing in urbanized areas by 2050. That equates to around 2.5 billion people, and a large infrastructure effort will be required to meet this demand. The industry outlook is constructive for REVG in my opinion.
Fundamental economics
The facts pattern supporting REVG’s buy thesis involves its ability to compound capital at an accelerated rate in the next 3-5 years. My views are guided by (i) the company’s growing pre-tax margins, (ii) competitive advantages in asset turnover, and (iii) supportive valuations.
With “value” on offer, investors have lifted the bid on the company share price and driven it from less than $10 a share this time last year to the $27s as I write.
The key catalysts to the re-rating in my opinion are as follows:
(1). REVG’s high ratio of sales produced on capital invested, with every $1 of investment drawing >$3 of sales (Figure 2). This indicates it has production/price advantages, suggesting REVG likely prices its offerings below industry averages. The capital investment per $1 of revenue is subsequently low.
(2). Because the revenues per $1 of capital are high, surplus funds can be allocated aggressively to churn out more volume and breadth. It’s perfectly reasonable to suspect that the high unit and dollar volumes + breadth attracts such a wide spectrum of customers that it ultimately boosts penetration. The high capital turnover ratio of >3x therefore picks up the shortfall in operating margins. This is a competitive advantage REVG has in my opinion and illustrates the key value driver of the company’s earnings.
Figure 2.
Company filings, BIG Investments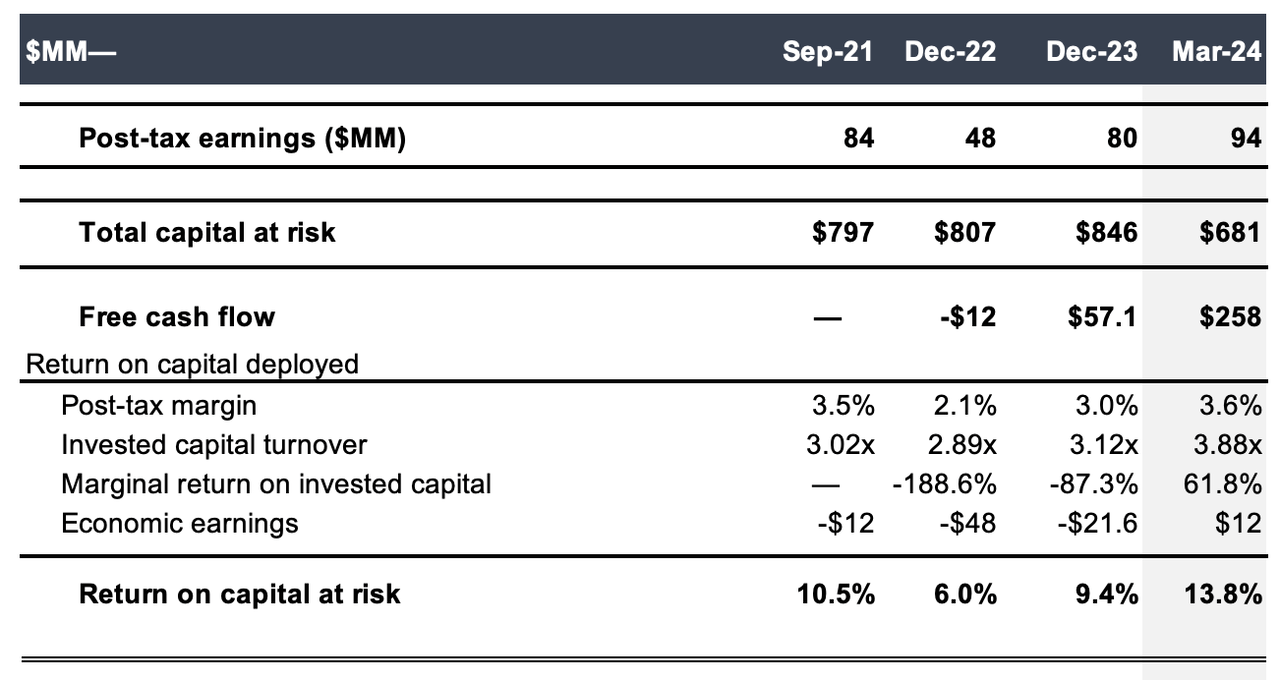
(3). Pre-tax margins have increased over the last 3 years, indicating that >$1 of earnings is being produced from $1 of incremental investment. This is supported in the data. From Q3 2021–Q1 2024, on a rolling 12 month basis, management invested an additional $0.80/share to maintain the company’s competitive position and increase margin growth (Figure 3). It grew net operating profit after tax (“NOPAT”) by $0.50/share from this, otherwise 63.1% marginal return on investment. This suggests management is deploying capital to an advantage and that we can expect further earnings growth should it continue. As seen in Figure 4, management has increased pre-tax margins substantially since REVG produced operating margin lows of c.2% in the 12 months to Q1 2023. Moreover, in times of (i) tight supply, and (ii) depressed markets/slow industry growth, customers turn to the low-cost provider, widening REVG’s consumer advantage in my view.
Figure 3.
Company filings, BIG Investments
Figure 4.
Company filings, BIG Investments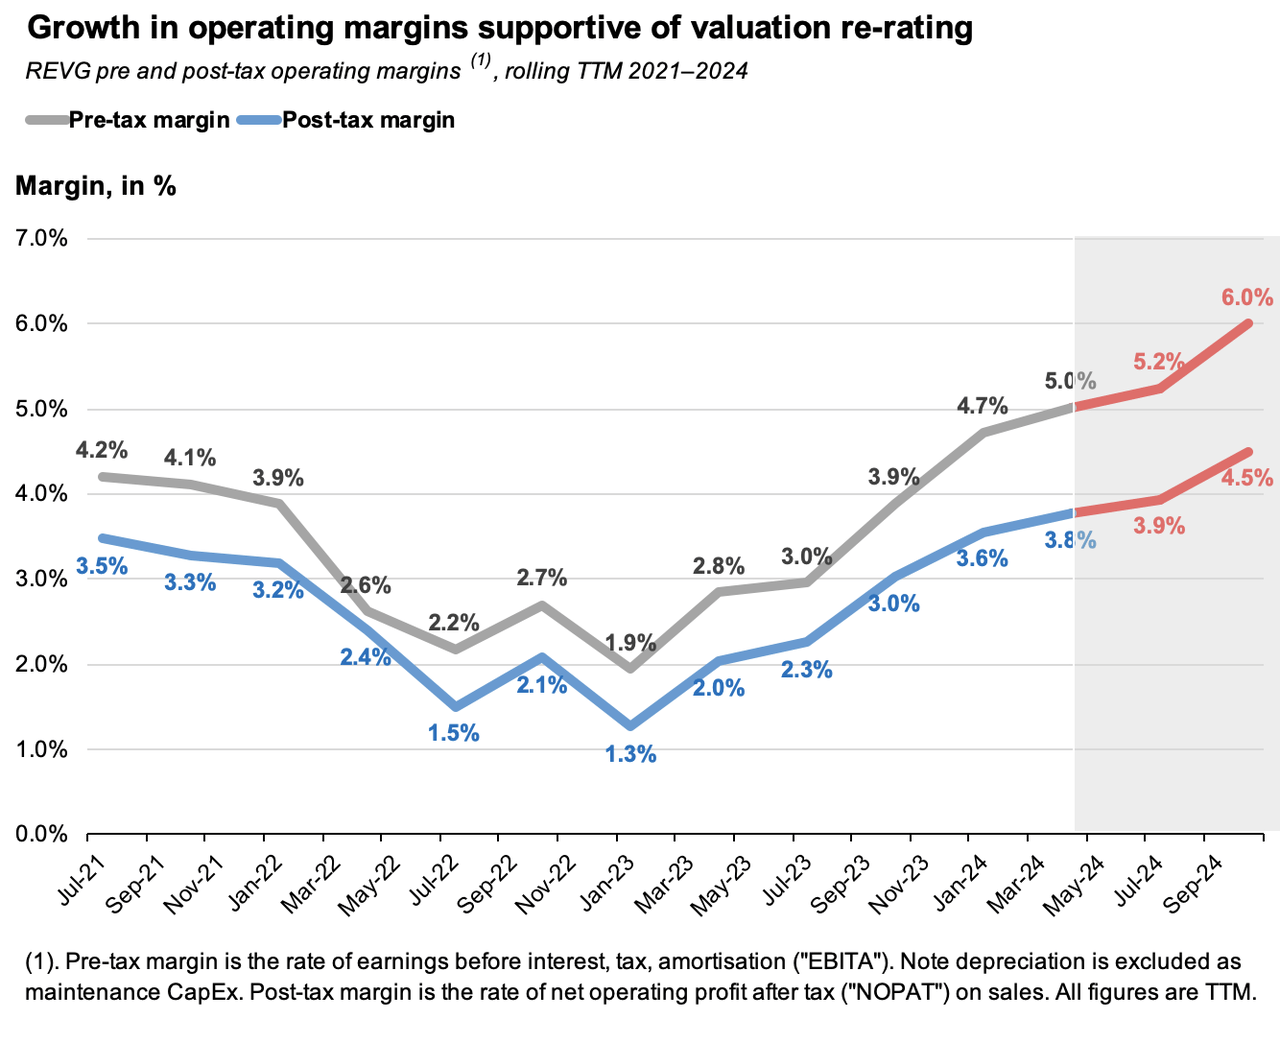
(4). The market looks to be taking notice of the ramp on pre-tax margin. For instance, the company’s 3 and 5-year sales growth is negligible at 4.7% and 2%, respectively. Consensus projects 7-8% top-line growth in FY’24. Meanwhile, 3 and 5 year EBIT growth is 60.7% and 16% respectively, and was up 203% YoY in ‘23, due to the increasing margin. As seen in the chart below, REVG’s market price has tracked TTM pre-tax income with striking similarity since 2017, with less correlation to net income or sales. Therefore, growth in EBIT and EBIT margin is a major plus for the company in my estimation.
Figure 5.
Seeking Alpha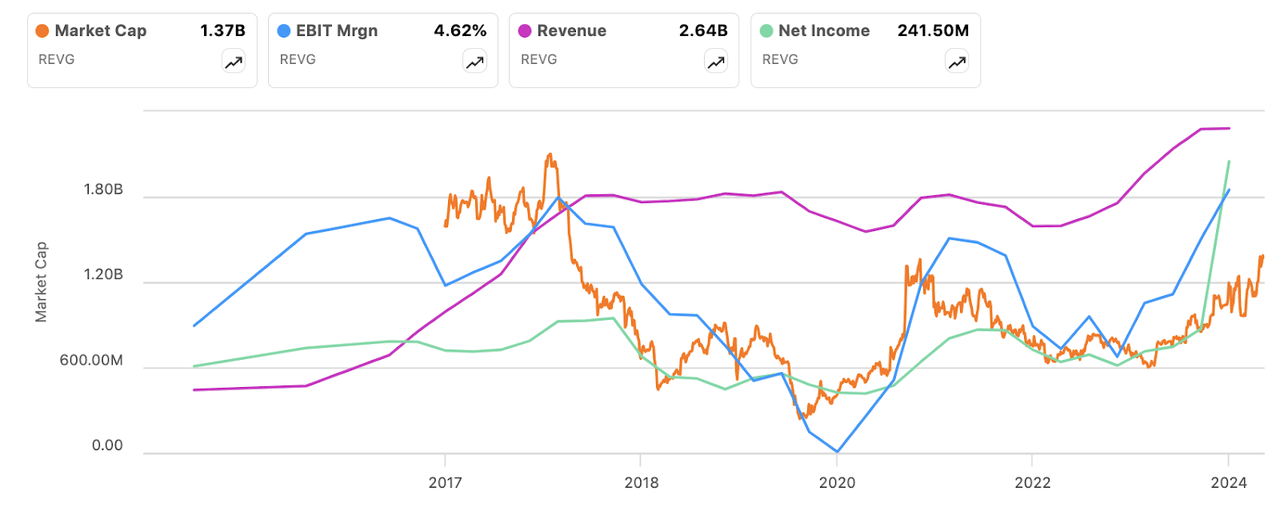
This also squares off with the economics of the business. Companies that produce decent returns on their assets by generating high revenues on capital will benefit most from an increase in operating margin, and vice versa. In my opinion, this is a central reason to the re-rating in market value across 2023/ 2024. Later, I will show how this plays into REVG’s corporate valuation as well. (6). The company enjoys higher than industry average gross margins but lower operating margins vs the industry, and most importantly – higher free cash flow margins than the industry. Consensus estimates imply a ~6% pre-tax margin for FY’24. Hence, REVG’s increasing margins could widen its competitive advantage in an economic downturn. Again, this squares off with my findings. The company’s capital is highly productive. It rotates high amounts of gross profit per $1 of assets employed on the balance sheet. As a result, gross profitability is high as a function of sales, and as a function of total assets.
|
Gross margin |
Pre-tax margin |
|
|
Industry Average |
10.47% |
10.98% |
|
Industry Median |
19.58% |
6.13% |
|
REVG |
12.16% |
4.62% |
Source: Bloomberg, company filings
However, due to the competitive economics of the company’s end-market, it is a race to the bottom on operating margin for these companies. As such, those with production advantages (i.e. high capital turnover) stand out, and can differentiate on price and volume. This enables REVG to appeal to a broader range of customers, in my opinion, and allows it to sell a greater breadth of products at multiple price points. REVG also requires minimal incremental reinvestment to maintain its level of profitability, and therefore can throw off attractive levels of cash to its owners (both in dividends and retained earnings). This is critical to my bullish views on the company. You can observe this via the growth in FCF per share, in the walk below. On a rolling 12 month basis, FCF lifted from $1.40/share in 2021, to $4.99/share in Q1 2024. Aside from this abnormal print, I would characterize the company’s FCF as stable and growing.
Figure 6.
Company filings, BIG Investments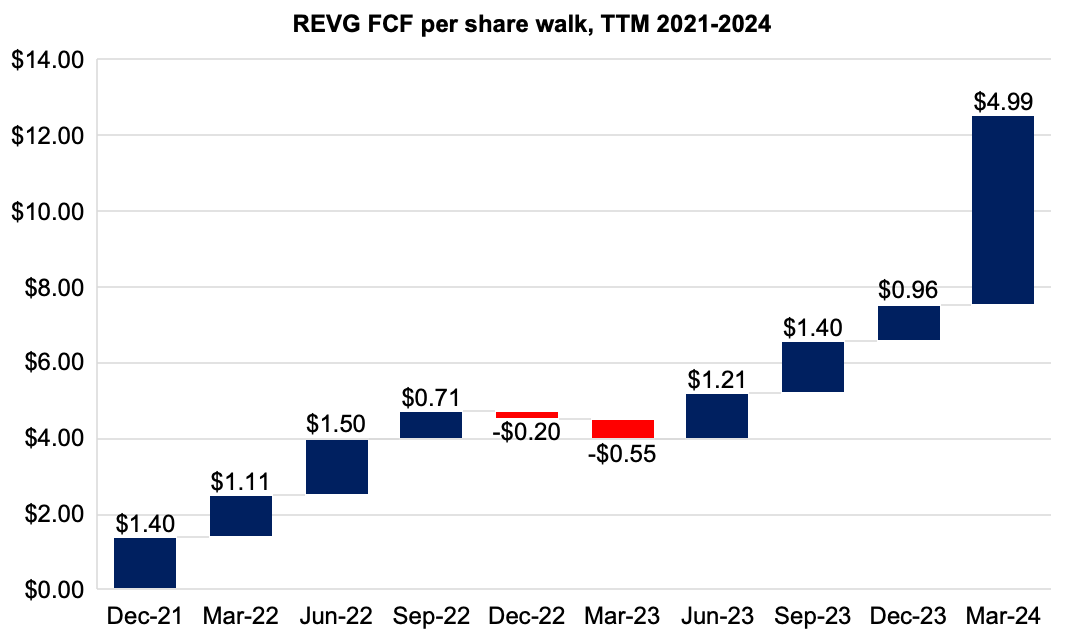
(7). Revenue per employee. Current management has done a good job at increasing employee productivity in my opinion. In 2017, the company did $2.27 billion in revenues on 7,800 employees. Each employee therefore averaged ~$290,600 in sales. In 2022, it did $2.27 billion, but with 6,873 employees – 927 fewer staff. Each staff averaged $331,296 in revenues. In 2023, this had lifted to $392,623. Since 2017, it has reduced staff headcount by 1,076, but increased revenues by $373 million. It is producing ~$102,000 more revenues per employee with 1,000 less human capital. Compare this to peer The Greenbrier Companies, Inc. (GBX), with $3.56 billion in TTM revenues on 13,800 employees, otherwise $256,000 average revenue per employee.
Figure 7.
Company filings, BIG Investments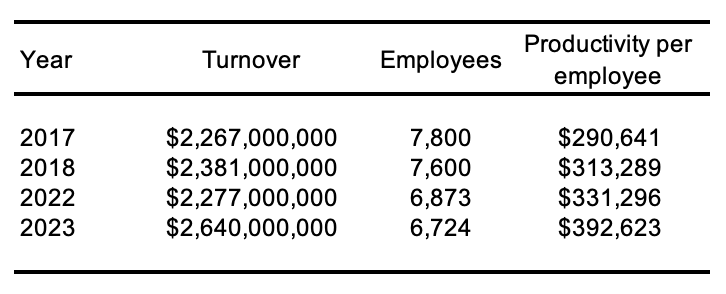
Factors impacting corporate valuation
Management’s capital allocation decisions are viewed in the exhibit below (Figure 8). It shows the investment required to produce $1.00 of new sales on a rolling 12 month basis from 2021. This is the “steady state” of operations.
Sales have grown at around 90 basis points per quarter on an average pre-tax margin of 3.3%. This is unsurprising given the economics I’ve discussed so far.
The majority of investment has gone toward working capital, with each new $1 in revenue commanding a $0.36 investment in inventory, receivables and payables. The investment towards fixed assets has been $0.07 on that dollar. In total, management has invested around $0.31 net to produce one dollar of revenue growth over this period. I described the outcome of these decisions earlier in this report – they have been favourable.
Figure 8.
Company filings, BIG Investments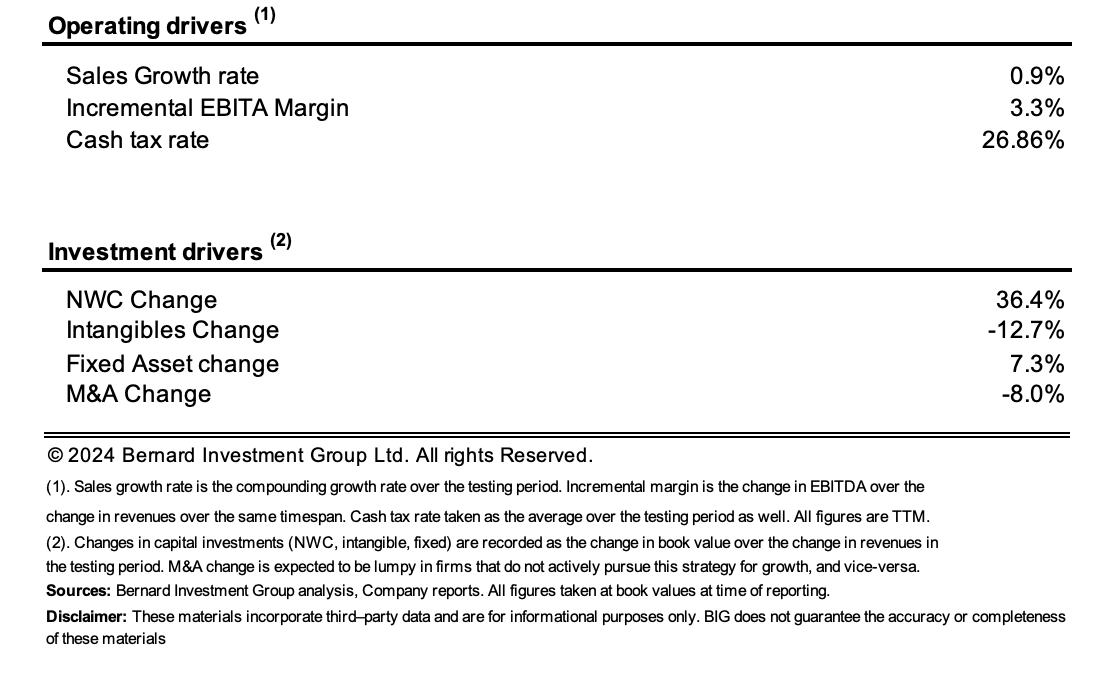
To participate in the company’s good fortune, we are asked to pay 10.8x trailing pre-tax earnings of $99.1 million. Consensus estimates are 65% growth in EBIT, implying $163.5 million in 2024.
This is absolutely critical to my investment thesis. This level of pre-tax income implies a pre-tax margin of roughly 6% on estimated 2024 sales, around 220 basis points upside on the company’s 2023 numbers.
The effect this has on REVG’s corporate valuation is immense, as I discuss below.
Figure 9.
Company filings, BIG Investments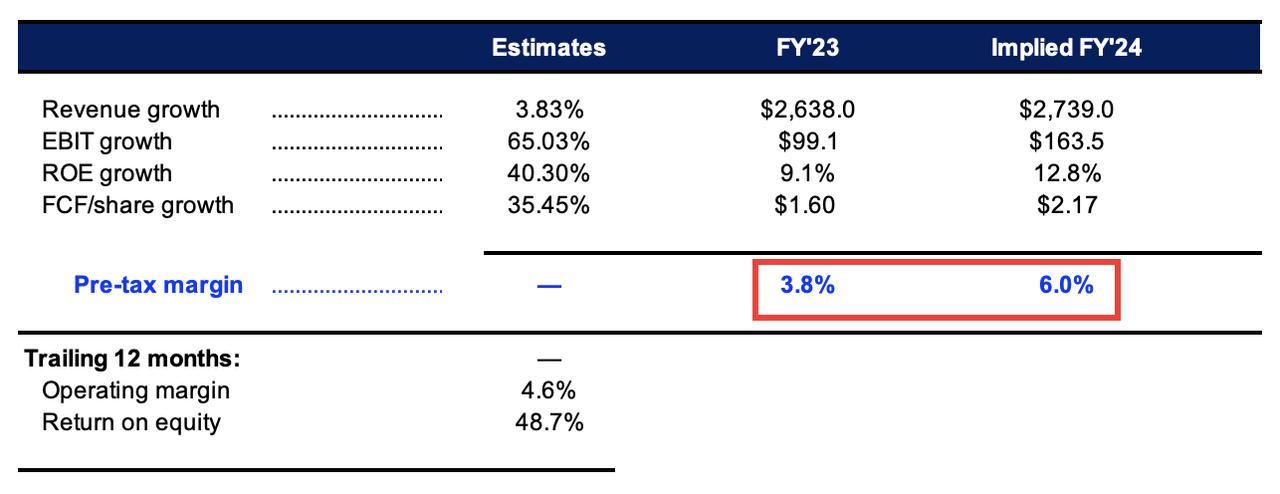
The company currently sells at 3.2x book value with a trailing return on equity of 48.7%. This is high, but is not as attractive on face value when deconstructed.
Unfortunately, the bulk of the company’s return on net tangible assets is driven by leverage. Net margins of 9.1% on asset turnover of 1.86x produce just 17% ROE without the equity multiplier of 2.86x. If paying the 3.2x book multiple, the investor ROE reduces to 15.2%, and just 5.3% when adjusted for leverage.
Similarly, it also trades at 1.94x EV/invested capital, meaning management has added $1.94 of market value for every $1 invested into the business. If paying this multiple, the company ROIC of 13.8% (TTM values) compresses to 7.1% for the investor. This must be heavily factored into consideration. To justify the current enterprise valuation, REVG would need to produce ROIC of around 23.5% moving forward.
Figure 10.
Company filings, BIG Investments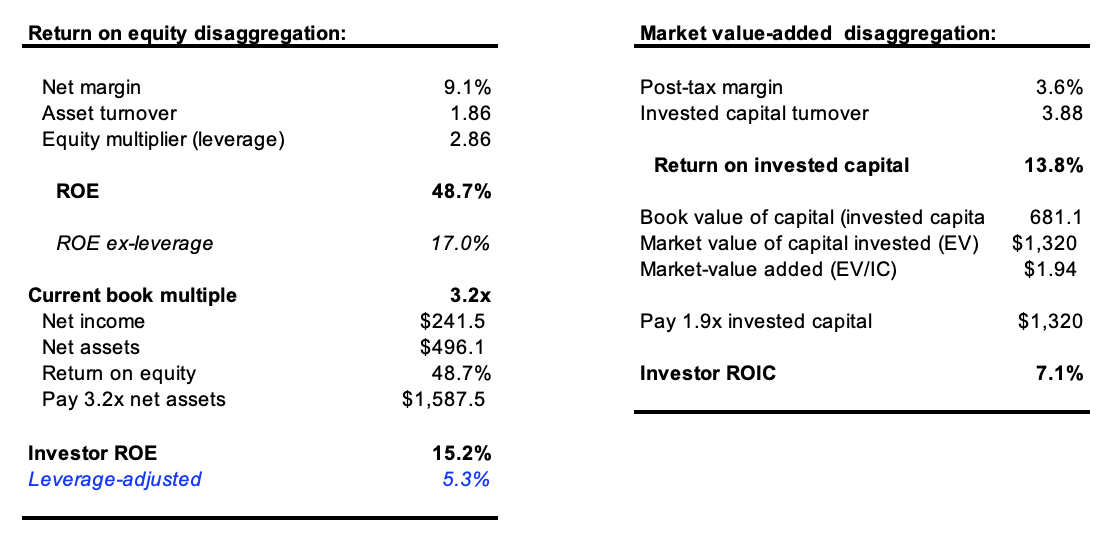
Critically – these assumptions don’t take into account the growth in operating margin I’ve discussed.
The stock trades at a 38% discount to the sector at 10.8x trailing EBIT. Consequently, there may be an advantage in this multiple if the company does, in fact, hit these growth and margin targets.
Let’s run the scenario when the company does grow pre-tax earnings by 65% to $163 million. If there is no change in the P/E multiple, the stock is worth $34.10 to us today, 25% upside as I write.
But if the multiple contracts to 7x (a sharp decrease) despite the level of growth, the stock may compress to a value of $22.10/share. This is an 18% decline in price from a 35% contraction in multiple, so the risk/reward calculus is stacked on our side.
Similarly, if the company only grows earnings by 30% year-on-year (around half the projected value), and the multiple doesn’t change, the stock is worth about what we’d pay for it today ($26.85/share). In my view, the company’s relative valuation is most sensitive to earnings, and the multiple appears cheap on this basis.
Figure 11.
BIG Investments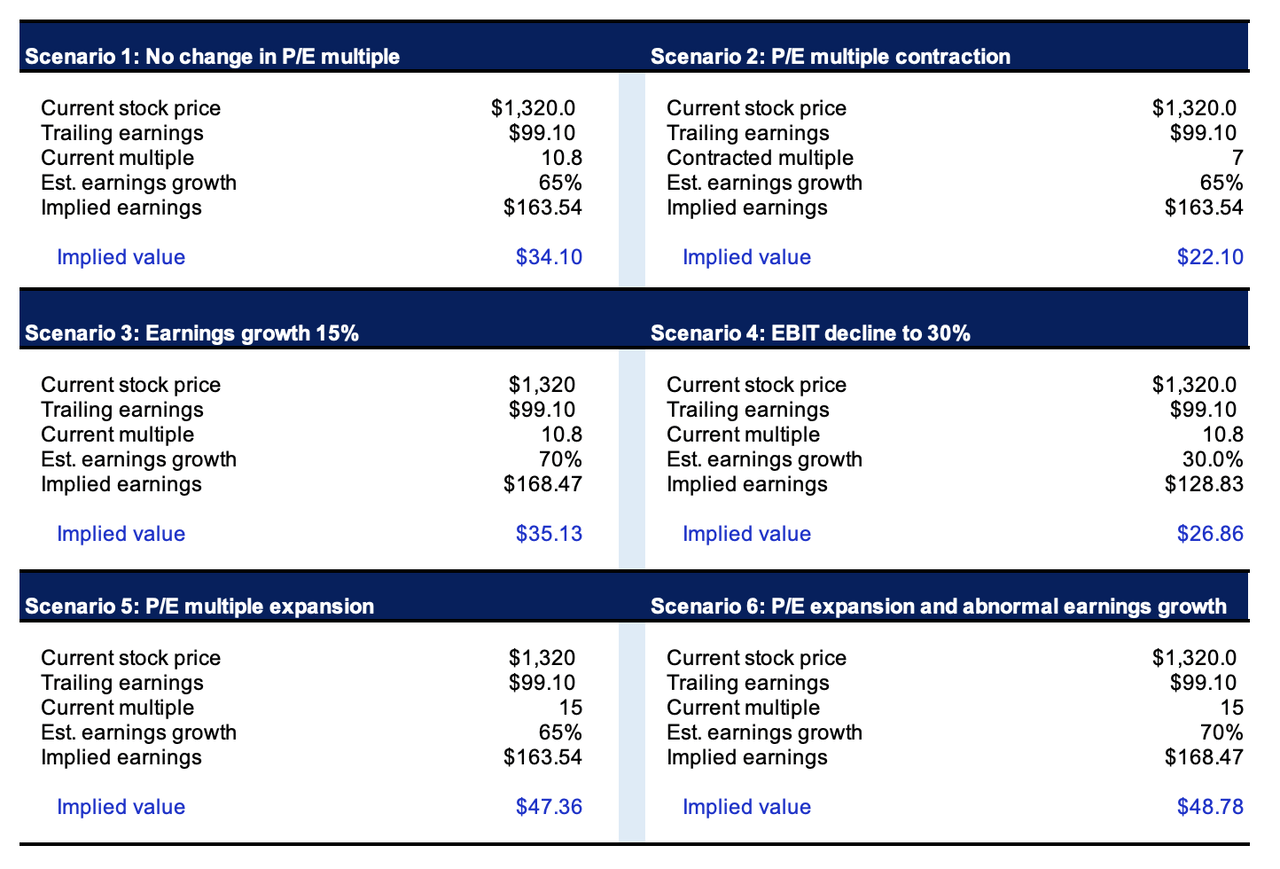
These are the distribution of outcomes produced from the scenarios above.
BIG Investments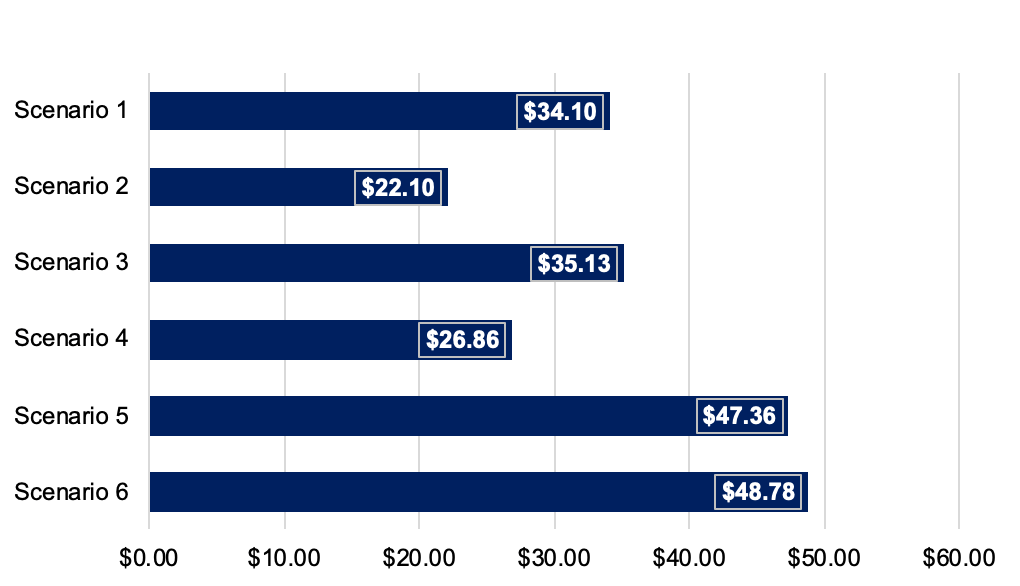
To illustrate how powerful this change in operating margin is to the company’s corporate valuation, I will turn to my projections in the exhibits below. They are built out over the coming five periods and illustrate what is expected from the company if it continues at its “steady state” of operations listed earlier. This includes less than one percent sales growth, and pre-tax margins of 3.3%. I then calculate the required earnings management must produce on the company’s invested capital to a 6% return.
In this analysis, I will be looking at the access or economic earnings above the passive rate on money, otherwise the yield on high quality corporate bonds which we can get at starting yields of 5 to 6% as I write. Any profits above this 6% return are considered economically valuable to us. Normally, I would put a 12% threshold margin on this, reflecting the long-term market averages. But I’ll be discounting the excess earnings at this 12% rate, so it is counterintuitive to use it in both instances.
In the first scenario with the 3.3% margin, the company produces reasonable economic earnings above what is required. Capitalizing the sum of these economic earnings at a 12% rate gets us to a valuation of $18.40 per share, below market as I write.
Figure 12.
BIG Investments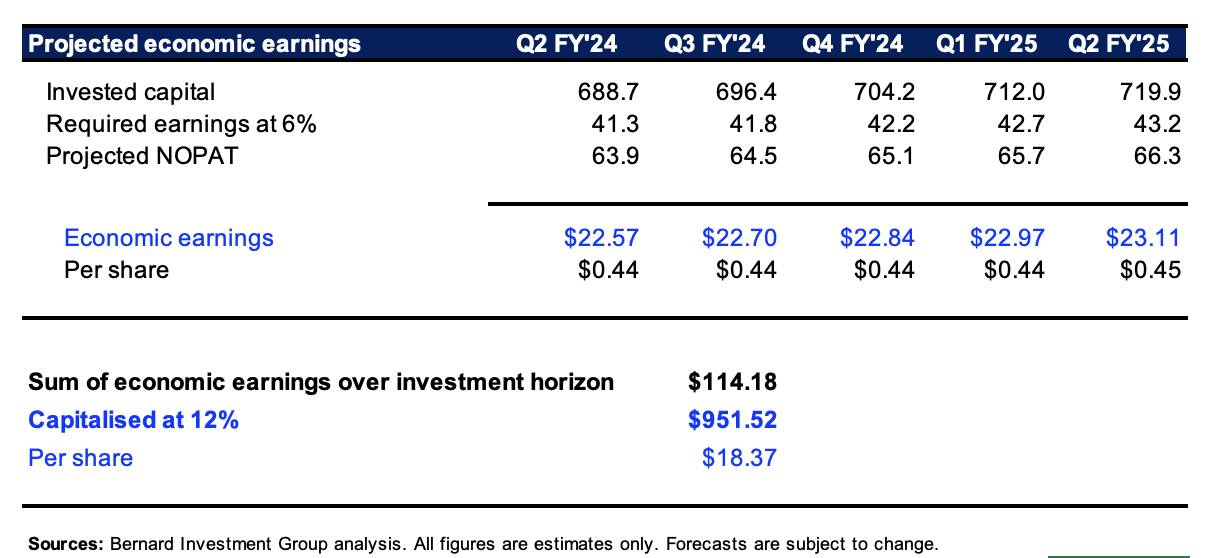
I then contrast this to forward estimates made with a 5% pre-tax margin (270bps increase), in line with estimates projected for the next couple years. This produces an enormous change in economic earnings. For instance, the company would need to produce $41.3 million in operating profit after tax to hit the 6% hurdle rate next period. If it produces a 5% pre-tax margin, it could do $97.5 million and produce economic earnings of $56 million in year 1. The sum of these projections over five years capitalized at 12% nets to a valuation of $45.80 (Figure 13).
To me, this is supportive of the notion that the increasing margins will have a highly positive impact on RVG’s implied valuation moving forward.
Figure 13.
BIG Investments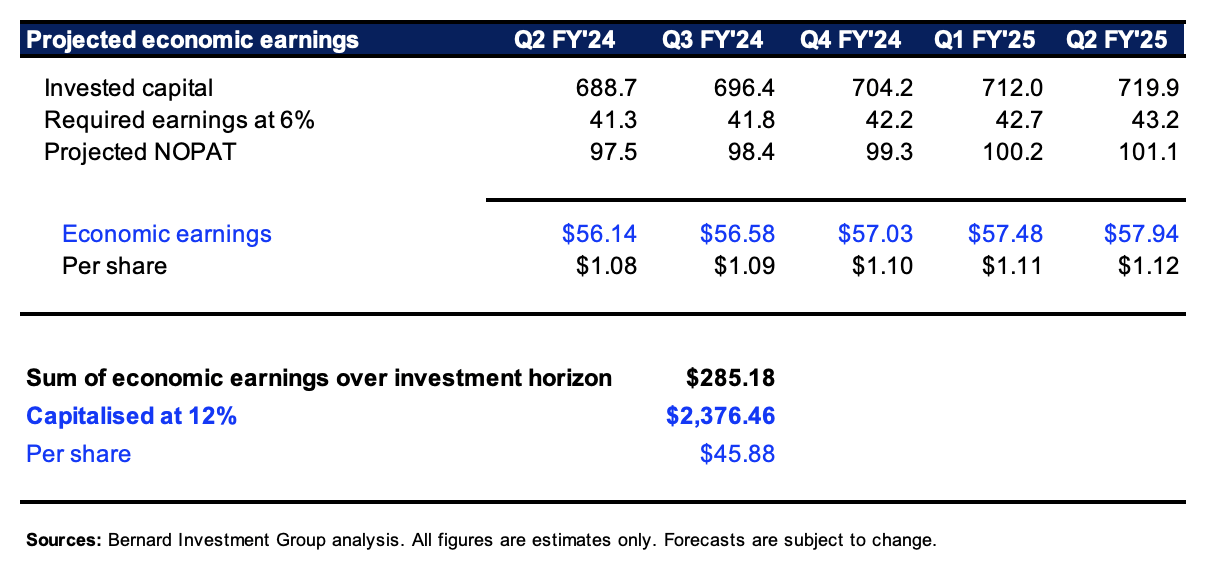
In short
The investment debate for REVG is supported by 1) industry tailwinds, 2) robust earnings growth, 3) increasing operating margins, 4) strong free cash flow production to hold up earnings and dividends, and 5) attractive valuations.
Our forward estimates project a positive valuation impact from each of these 5 factors, including a wide margin of safety with the stock priced at 10.8x trailing EBIT. If the company does hit targets outlined in this report, I estimate REVG is worth around $34/share in the base case (earnings growth with no change in EV/EBIT multiple), to $45-$48/share (increase in pre-tax margin and increase in multiple). Moreover, in the downside case, I estimate the stock is worth about what I would pay for it today. At best, it could be worth multiples of. Net-net, rate buy.
Read the full article here

