Risk management is a core tenet for any responsible investor. In an election year, with precarious geopolitics, and an uncertain macro environment, it would be wise for investors to consider a low volatility allocation if they have not already. Fidelity Low Volatility ETF (NYSEARCA:FDLO) is an ETF we like. It has a combination of simplicity, price, and sustained long-term performance that gives me confidence it can play that low volatility role nicely. We rate FDLO a buy.
A low volatility allocation is one tool to help investors manage total portfolio risk, provides downside protection, while still providing competitive returns. In severe market downturns, typically all equities suffer, but there is something to be said for suffering less.
With so many low volatility ETFs, why this one?
FDLO tracks the Fidelity U.S. Low Volatility Factor Index, and the ETF currently holds about 125 stocks. FDLO defines its Low Volatility factor very specifically, and in as transparent a manner as about any ETF we’ve seen. We’d expect that from Fidelity, a mutual fund icon trying to find its footing in the ETF business. As indicated by its $1.05 billion asset base more than 7 years after its inception, Fidelity is not invading iShares turf just yet. $1 billion in assets is a trace amount compared to what Fidelity garners in many of its mutual funds. That may have some benefits here, since for now that asset base is actually small enough to allow the ETF to consider a broad range of stocks.
Transparent definition of low volatility a key to our positive rating
FDLO uses an equally weighted composite score based 5-year Standard Deviation of Price Returns, 5-year Beta, as well as 5-year Standard Deviation of EPS for a given security in a universe. In addition to price volatility, and the ETF’s sensitivity to market fluctuations, the EPS component considers the financial stability of a given company.
The look-back period of 5 years gives us a more comprehensive understanding of how a security’s risk characteristics over time, and is consistent with how we should evaluate the “success” of a low volatility approach, which is to provide favorable risk adjusted returns over time. We think it is important for investors to internalize the time horizon necessary for a low volatility strategy to deliver on its objectives.
Composite Volatility scores are initially calculated within a given sector, as some sectors (typically defensive sectors) will likely display lower volatility relative to others, such as Consumer Staples or Utilities. Composite scores are also adjusted for the Size factor, to minimize concentration in larger market cap companies within a given sector.
When compared in its peer universe of other Large Cap Low Volatility ETFs, FDLO is fairly priced, with an expense ratio of 0.15%.

Seeking Alpha
FDLO has also provided the best 5-year total return within its given peer universe, delivering a more than 80% cumulative gain. And while that advantage, or even the potential for positive performance from FDLO going forward will be market-dependent, these past 5 years have been a good stress test for this factor equity style. During that time, we endured the pandemic as well as the 2022 stock market debacle. Relatively speaking, FDLO did bend, but didn’t break.

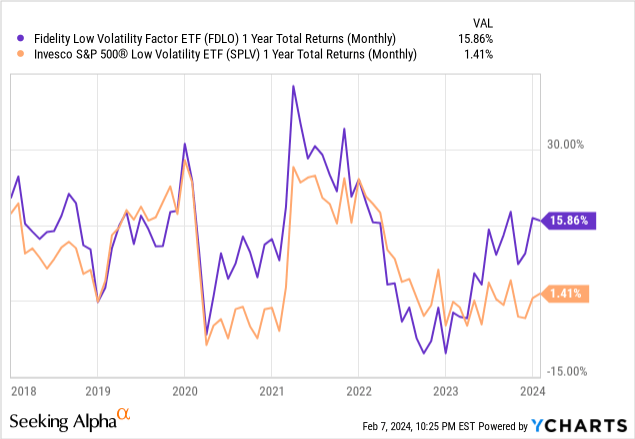
If there were ever a testament to FDLO’s historical ability to live up to the low volatility ideal, the above chart is it. Rarely has it underperformed category giant Invesco S&P 500 Low Volatility ETF (SPLV) over a 1-year period. And at a time when many classic “low vol” stocks underperformed, FDLO bested SPLV by more than 17% in the most recent 12-month marking period.
Holdings analysis
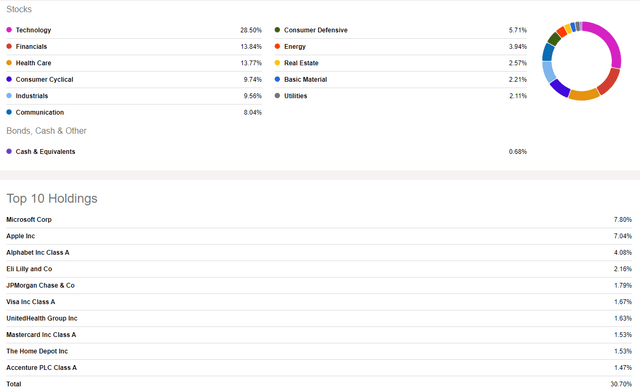
At first glance, an investor might look at the sector allocation below and the top 10 holdings, especially the top 2, and think “that’s not low volatility, those are giant tech stocks.” And while that did characterize the tech sector for most of our investing lives, the fact is that those mega-cap icons have been more of a “flight to safety” than a source of volatility in recent years.

Seeking Alpha
If there is an obvious risk to FDLO, it may lie in the potential for stocks and sectors that exhibited lower volatility in the past to cease doing so. For instance, if the stock market suddenly returned to the olden days of utilities and consumer staples stocks being the escape route for equity managers, this ETF would be at least temporarily vulnerable. But that’s been a rumored risk for funds like this for several years, and it might be a modern reality of the stock market: bigger, cash flow gorillas might just be the new “low vol.”
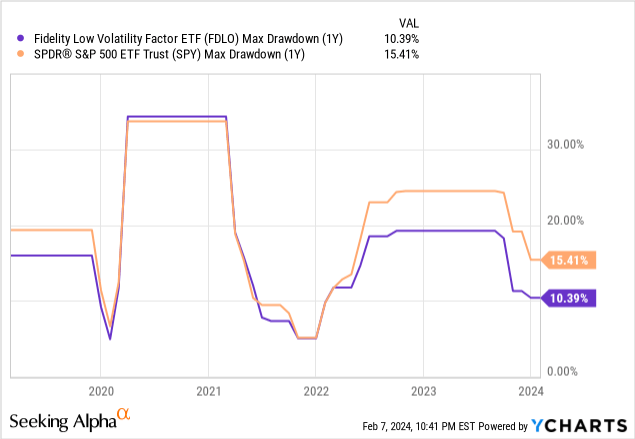
And, it is important to distinguish between low volatility and lower volatility stocks. In a market crash, all stocks are volatile, especially with so much of the market indexed, and thus traded in “basket” form. The chart below shows that FDLO’s maximum drawdown about matched that of SPY during the 2020 pandemic crash, and approached 20% during 2022’s bear market.

FDLO: best of breed
Periods of market volatility are both impossible to predict and impossible to avoid. Short-term market movements can tempt even the most level-headed investors to make an emotionally driven investment decision.
A sleeve allocated to a Low Volatility ETF is one way to help safeguard capital and potentially generate income for investors that have prioritized those investment objectives. Based on FDLO’s transparent methodology, price, and performance over the long term we rate this ETF as a buy.
Read the full article here

