It’s been a tough 3-month stretch for the Retail Sector (XRT), with several names sliding over 30% from their highs, dragging XRT down ~15%, a 500 basis underperformance vs. the S&P 500 (SPY). However, warehouse club chains and off-price retailers have been a sanctuary during the storm, reporting less shrink and traffic growth as consumers are consistently on the hunt for value. Some examples include TJX Companies (TJX) and Ollie’s Bargain Outlet (OLLI), and BJ’s Wholesale (NYSE:BJ), with the latter up 12% since the end of Q1, significantly outperforming the XRT which has suffered a ~9% decline. And while the company’s Q2 results were a little softer than I expected, BJ’s Wholesale continues to make strong progress executing against its long-term goals, and is still in the earlier innings of its growth, with a relatively modest store count of ~240 stores focused in the eastern United States. Let’s take a closer look at the recent results and its H2 outlook below:
Wellsley Farms Private Label Brand – BJ’s Presentation
Recent Results
BJ’s Wholesale (“BJ’s”) released its Q2 results in late August, reporting quarterly revenue of $4.96 billion, a 3% decline from the year-ago period, and a sharp decline sequentially from the 5% sales growth reported in Q1. This was driven by [-] 5.3% comp sales growth or 1.1% excluding its gas segment, with the latter representing a 4.6% decline sequentially (Q1 2023: 5.7%). That said, the company was up against difficult comparisons year-over-year as trips were up due to peak gas prices in the year-ago period (BJ’s provides gas 5 to 15 cents per gallon of gas savings for its members depending on their tier), and it was also a slightly better macro environment, with several more rate hikes now in the picture and a more tapped out consumer overall. And while BJ’s is a trade-down beneficiary and its grocery business performed well (~70% of revenue), general merchandise & services remained quite weak, down 13% year-over-year.
BJ’s has carved out a unique niche with its club warehouse model with a superior value vs. grocery stores, larger pack sizes vs. department stores like Walmart (WMT) and Target (TGT), and more SKUs and smaller packs vs. competition like Sam’s Club and Costco (COST).
BJ’s Wholesale – Quarterly Revenue – Company Filings, Author’s Chart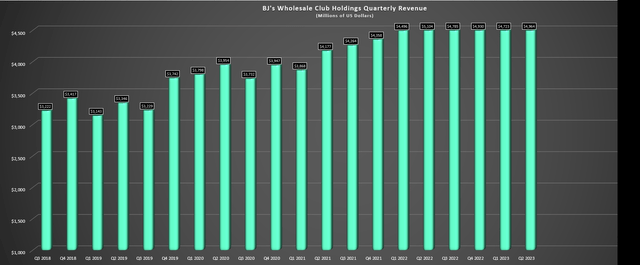
Digging into the results a little closer, BJ’s shared that it ended the quarter with over 7.0 million members and that digitally enabled comp sales increased 15% year-over-year. This is an encouraging statistic given that club members using digital spend ~70% more than average members, and it explains why BJ’s is working to improve convenience to drive digital conversion with same-day delivery and buy online pick up curbside. Additionally, the company noted that it saw gains in traffic, saw accelerated market share growth and that its comp sales were driven entirely by traffic. And while a 1.1% comp may not be much to write home about, comp sales were up 20.9% on a two-year stack basis (Q2 2022: 19.8%), and 1.1% comp sales driven entirely by traffic is much more impressive than the low- to mid-single digit comps being reported by many restaurant brands on the back of negative traffic growth and driven entirely by pricing, with high single-digit menu price increases not being sustainable long-term.
BJ’s Wholesale – Club Support Center, DCs, and BJ’s Clubs – Company Website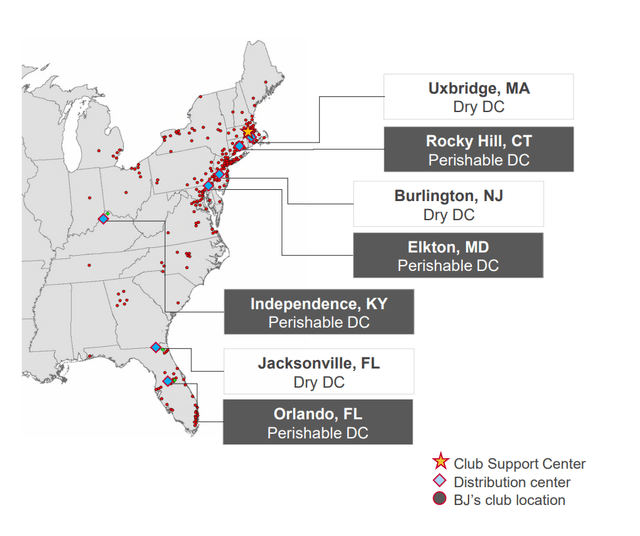
As for performance across segments, gas was a headwind with a slight decline in comparable gallons, and general merchandise & services revenue was down 13% year-over-year, continuing a trend discussed in Q1 where it’s seeing less large ticket purchases (electronics, patio & outdoor furniture) which makes sense given that consumers are being judicious for spending. However, grocery performed well with growth in snacks, beverages, breakfast items, dairy, frozen, and bakery, and this makes sense given that we’ve seen some trading down by higher-end consumers, suggesting that even higher income cohorts are looking for value. And in BJ’s case, it’s positive to see not only are overall trips to BJ’s up among members, but it’s seeing growth across all income cohorts. Finally, membership fee income was up 5% year-over-year to $103.7 million, and the company opened one club and gas station in the period, ending the quarter with 238 clubs.
Updated Outlook & Industry-Wide Trends
While there were some positives in the Q2 results and the macro environment continues to favor consumers to value options like BJ’s, the company took its FY2023 comp sales from a mid-point of 4.5% to 2.0%, and adjusted earnings per share from “approximately flat” implying annual EPS of $3.92 to $3.80 to $3.92. This was a little disappointing but is not surprising given that the tough macro outlook is likely continuing to weigh on the general merchandise and services segment, which fortunately makes up less than 15% of sales. That said, even if BJ’s annual EPS declines this year, the company has done an impressive job of growing annual EPS since going public despite modest unit growth (221 clubs –> 238 clubs), with strong comp sales growth and opportunistic buybacks. In fact, annual EPS is up ~190% since FY2018 or a ~34% compound annual growth rate even if annual EPS dips this year.
BJ’s – Earnings Trend – Company Filings, Author’s Chart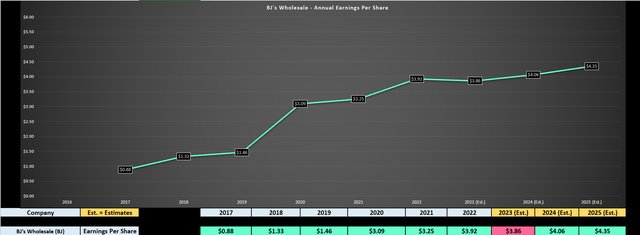
As for industry-wide trends, investors might be concerned about the softness in general merchandise and services, but as BJ’s noted in its prepared remarks, these are items with longer buying cycles and it’s likely that consumers already made their purchases in these categories over the past two years with stimulus and the investments many consumers made in their homes/backyards during lockdowns. Plus, the company remains quite optimistic about the future of this category and believes it can grow substantially over the long term. If successful, this would certainly be a needle-mover given that savings are exponentially higher for those BJ’s members also shopping general merchandise, suggesting higher overall sales and also a higher value proposition for memberships which should in turn mean higher renewal rates.
BJ’s Sales Reported vs. Estimates – Seeking Alpha Premium US Personal Savings Rate – FRED, BLS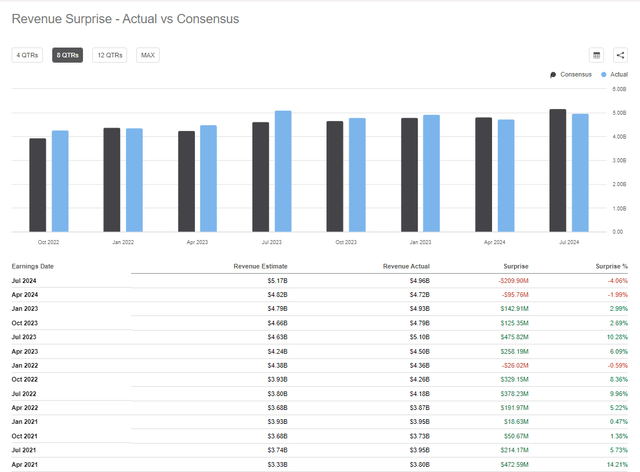
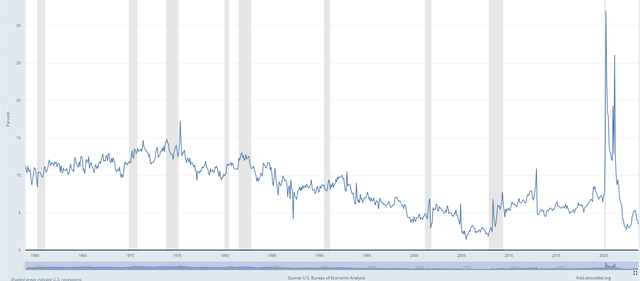
On the negative side, the company reaffirmed that competition is fierce and while it appears to win market share, much of the retail space has become promotional in an attempt to win traffic. And while the company is executing well with sales growing “nearly two times as fast” vs. key competition in its markets, the declining personal savings rate and pinched wallets could continue to put pressure on its more discretionary and higher ticket categories. Hence, while BJ’s will be able to grow annual EPS as it ramps up club growth and works to improve margins (own brand penetration, better inventory management), it’s a more difficult environment when it comes to beating estimates, evidenced by BJ’s seeing more misses lately than investors have been used to (two consecutive misses on sales estimates after beating 12/13 quarters heading into 2023). Hence, when it comes to the Q3 results expected next month, it’s hard to be overly optimistic about BJ’s beating on sales vs. current estimates of $4.93 billion and that would imply only 3% growth year-over-year. Let’s see if this is priced into the stock:
Valuation
Based on ~133 million shares and a share price of $71.00, BJ’s trades at a market cap of ~$9.45 billion and an enterprise value of ~$12.5 billion, placing it ahead of most of its peers from a capitalization standpoint. And from a valuation standpoint, the two years that the stock has spent going sideways have certainly improved its valuation, with the stock going from trading at ~22 next year’s earnings estimates at its November 2021 peak to just ~17.5x FY2024 estimates today, with the stock sitting closer to its long-term average. Given the company’s solid execution to date (higher renewal rates, acceleration in unit growth rates, private label penetration), I think a fair multiple for the stock is 20.0x. This translates to a fair value for BJ’s Wholesale of $81.20 based on FY2024 estimates of $4.06, pointing to a 14% upside from current levels.
BJ’s Wholesale Historical Earnings Multiple & Insider Selling – TIKR.com, Nasdaq.com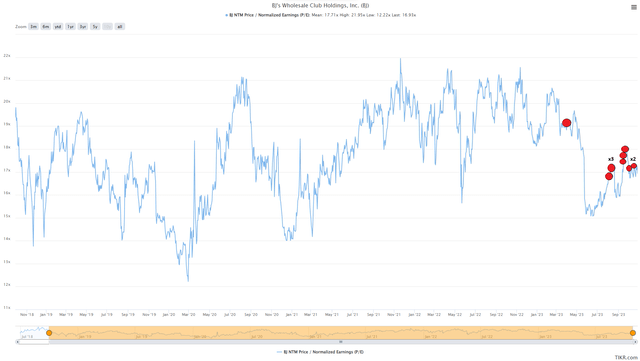
That said, I am looking for a minimum 25% discount to fair value for mid-cap stocks even if they are trade-down beneficiaries, and if we apply this discount to BJ’s estimated fair value of $81.20, its ideal buy zone comes in at $60.90. Hence, I don’t see an adequate margin of safety at current levels, hence why I exited my position above $70.00 for a ~14% gain from my purchase in late May. Obviously, I could be wrong and BJ’s may not make a double bottom and head back to this level. Still, I prefer to buy at a deep discount to fair value or pass entirely, and after an ~18% rally off its lows, I continue to see more attractive bets elsewhere in the market currently. One name that stands out is Aritzia (OTCPK:ATZAF), trading at less than 13x CY24 earnings estimates with high single-digit unit growth with significant insider buying (shown below). And in the case of BJ’s Wholesale, we’ve actually seen a decent amount of insider selling (shown above) between $70.00 to $76.00 over the last six months.
Aritzia Insider Buying – SEDI Insider Filings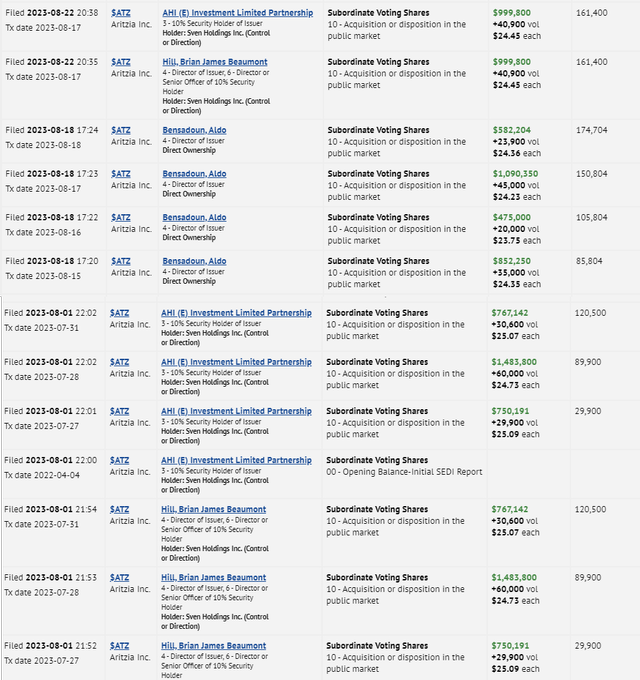
Summary
BJ’s Wholesale took its guidance down slightly in its recent Q2 results (2% comp sales growth vs. 4.5% mid-point previously) and noted that it continues to see softness in general merchandise & services, even if its other categories continue to perform well. On a positive note, the company shared that it continues to see sales growth across all income cohorts with higher trips, a key indicator when it pertains to membership renewal. That said, while the company continues to execute well, and has carved out a unique spot in the market as a trade-down beneficiary, I don’t see enough of a margin of safety in the stock just yet at ~17.5x FY2024 earnings estimates. So, while I would become much more interested in the stock if we were to see a dip below $61.00, I continue to see more attractive bets elsewhere in the market today.
Read the full article here

