When the facts change, I change my mind. What do you do sir?” – John Maynard Keynes.
The basis of disciplined financial science is that there are no sacred cows. Based on the best available data about the past, present, and likely future of a company the disciplined and smart investor always makes the highest probability decisions while always maintaining appropriate risk management.
- If You’ve Bought Nvidia Stock This Year, Sell Before Earnings (Downgrade)
In May, I warned that Nvidia Corporation (NASDAQ:NVDA) could crash if it disappointed in earnings.
“The Triumph Of Hope Over Experience” – Oscar Wilde
FAST Graphs, FactSet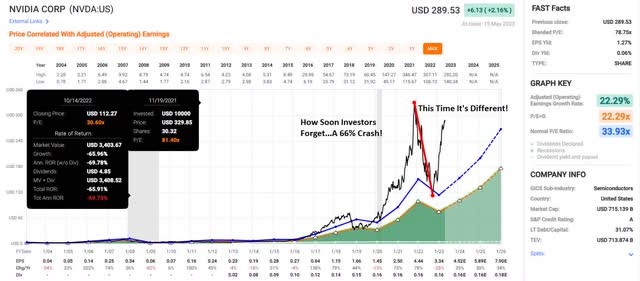
Let us walk through and debunk the “this time is different” arguments for why Nvidia Corporation at 66X forward earnings somehow makes sense.
The four most dangerous words in investing are: ‘this time it’s different.'” – Sir John Templeton.
And then Nvidia blew earnings out of the water, hiked guidance by 50%, and soared 30% in a single day. It actually became less overvalued despite soaring in value. That’s how strong the results were.
Ycharts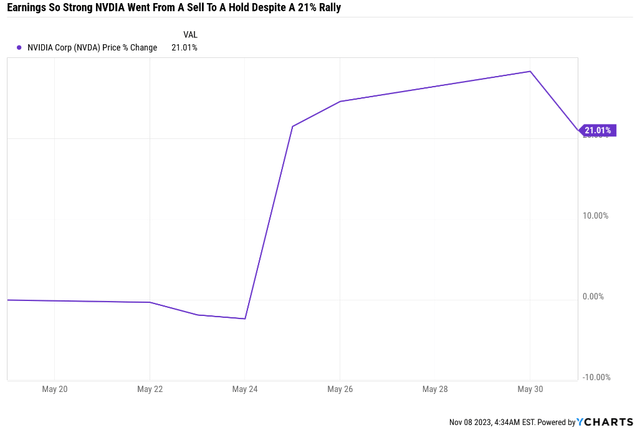
Earnings estimates soared almost 60% after that blowout result, and the stock price was up “just” 20% so Nvidia got a lot less expensive.
NVDA’s Short-Term Growth Prospects Became Sensational
| Metric | 2022 Growth | 2023 Growth Consensus (recession) | 2024 Growth Consensus |
2025 Growth Consensus |
| Sales | 1% | 59% | 23% | 22% |
| Dividend | 0% | 6% | 18% | 10% |
| Earnings | -25% | 128% | 30% | 21% |
| Operating Cash Flow | -37% | 212% | 40% | 9% |
| Free Cash Flow | -47% | 236% | 46% | -2% |
| EBITDA | -36% | 194% | 31% | 17% |
| EBIT | -44% | 285% | 29% | 22% |
(Sources: FAST Graphs, FactSet Research Terminal.)
Nvidia 2025 Consensus Total Return Potential
FAST Graphs, FactSet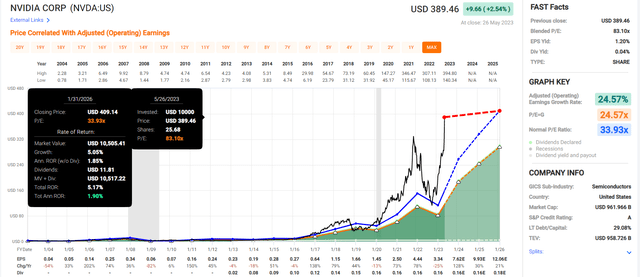
Nvidia Corporation’s explosive growth was completely priced in for the next three years. If NVDA grows as expected and returns to its 20-year historical market-determined fair value of 34X earnings (while growing at the same rate analysts currently expect:
- 2026: 48% total return = 10% annually
- 2027: 89% total return = 13.6% annually
- 2028: 138% total return = 15.6% annually
- 2029: 199% total return = 20.0% annually.
The overall return prospects for Nvidia were good, but the margin of safety was too low to actually recommend a buy.
- Unless you think a 60% bear market on the way to tripling your money in 10 years is a fun time.
The outlook changed drastically for Nvidia yet again because 258% growth from 2023 to 2025 is now much bigger than 487% earnings growth in 3 years.
Latest Nvidia Medium-Term Growth Consensus
| Metric | 2023 Growth Consensus (Fiscal Year) | 2024 Growth Consensus | 2025 Growth Consensus |
2026 Growth Consensus |
| Sales | 1% | 104% | 47% | 15% |
| Dividend | 0% | 6% | 0% | 6% |
| Earnings | -25% | 223% | 54% | 18% |
| Operating Cash Flow | -37% | 342% | 60% | 24% |
| Free Cash Flow | -53% | 545% | 55% | 25% |
| EBITDA | -36% | 343% | 52% | 17% |
| EBIT |
(Source: FAST Graphs, FactSet.)
An 1153% increase in free cash flow in 3 years…I have never seen anything like it from any large company.
Let me show three other shocking reasons that Nvidia and its mad genius CEO are blowing away expectations quarter after quarter and why the best available data now says Nvidia is a potentially good buy for anyone comfortable with its risk profile.
Reason 1: Growth Prospects That Are Sensational
The bottom line up front for anyone thinking that I’m just momentum chasing and eager to recommend a red hot momentum stock.
Nvidia Return Potential Before Earnings
FAST Graphs, FactSet
Nvidia Return Potential After Earnings
FAST Graphs, FactSet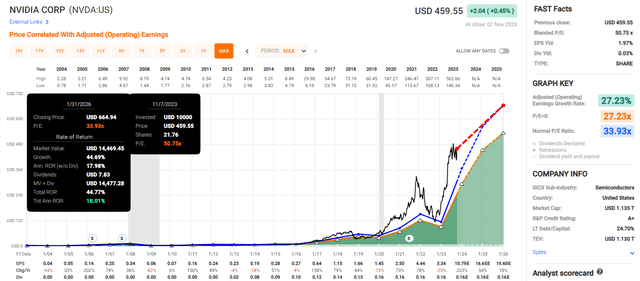
Before earnings, you were looking at flat returns for two years and maybe a 60% crash between now and then.
Only a speculator would call that a sensible investment.
There are two times in a man’s life when he should not speculate. When he can’t afford it and when he can.” – Mark Twain.
Now, there is an 18% annualized return potential if NVIDIA grows as expected (more on that in a moment) and returns to its historical market-determined long-term fair value of 34X earnings.
The best available data shows Buffett-like return potential from the world leader in advanced chips.
But wait a second, isn’t Nvidia still overvalued based on 2023 estimates? Yes but remember that Wall Street’s favorite valuation metric is 12-month forward earnings.
- We’re 85% of the way through 2023 so now use 85% of 2024 estimates blended with 15% 2023.
That’s not my opinion; that’s the most popular valuation metric used by billionaire hedge fund managers and analysts covering stocks. If everyone is looking 12 months out, you better be too, or you’ll make all investment decisions in the rearview mirror.
| Rating | Margin Of Safety For Very Low-Risk 13/13 SWAN Quality | 2023 Fair Value Price | 2024 Fair Value Price | 12-Month Forward Fair Value |
| Potentially Reasonable Buy | 0% | $342.69 | $559.85 | $530.69 |
| Potentially Good Buy | 5% | $325.56 | $531.86 | $504.16 |
| Potentially Strong Buy | 15% | $291.29 | $475.87 | $451.09 |
| Potentially Very Strong Buy | 25% | $244.17 | $419.89 | $398.02 |
| Potentially Ultra-Value Buy | 35% | $222.75 | $363.90 | $344.95 |
| Currently | $459.55 | -34.10% | 17.92% | 13.41% |
| Upside To Fair Value (Including Dividends) | -25.39% | 21.86% | 15.52% |
In the next 12 months, if NVDA grows as expected and returns to its 20-year historical fair value, then that’s 16% upside potential and 45% in the next two years.
- S&P 500 upside potential 13% by 2025.
Is the ability to potentially triple the market’s returns a potentially good buy for anyone comfortable with NVDA’s risk profile and hyper-volatility?
I would argue yes.
Just take a look at these incredible growth estimates.
FactSet Research Terminal
Six months ago, NVDA’s median growth consensus from all 54 analysts who cover it for a living and collectively know it better than anyone but its CEO was 17% long-term growth.
3 months ago it jumped to 27% and now up to 35%.
Here’s how that looks in the medium-term.
Nvidia Medium-Term Growth Consensus
| Year | Sales | Free Cash Flow | EBITDA | EBIT (Operating Income) | Net Income |
| 2022 | $26,969 | $4,176 | $10,863 | $9,350 | $4,825 |
| 2023 | $52,317 | $22,135 | $28,195 | $28,483 | $22,354 |
| 2024 | $78,428 | $37,894 | $44,451 | $46,306 | $37,017 |
| 2025 | $93,390 | $47,055 | $53,400 | $53,927 | $42,357 |
| 2026 | $108,207 | NA | $43,441 | $61,267 | $50,297 |
| 2027 | $129,793 | NA | $51,965 | $74,005 | $60,989 |
| 2028 | $146,190 | NA | NA | $91,107 | $79,361 |
| Annualized Growth 2022-2028 | 32.54% | 124.19% | 36.76% | 46.15% | 59.47% |
| Cumulative 2023-2028 | $608,325 | $107,084 | $221,452 | $355,095 | $292,375 |
(Source: FactSet Research Terminal.)
Have you ever seen a large A-rated company grow at these rates for this wrong? I haven’t, and I’ve been investing for over two decades.
NVIDIA Medium-Term Margin Consensus
| Year | FCF Margin | EBITDA Margin | EBIT (Operating) Margin | Net Margin |
| 2022 | 15.5% | 40.3% | 34.7% | 17.9% |
| 2023 | 42.3% | 53.9% | 54.4% | 42.7% |
| 2024 | 48.3% | 56.7% | 59.0% | 47.2% |
| 2025 | 50.4% | 57.2% | 57.7% | 45.4% |
| 2026 | NA | 40.1% | 56.6% | 46.5% |
| 2027 | NA | 40.0% | 57.0% | 47.0% |
| 2028 | NA | NA | 62.3% | 54.3% |
| Annualized Growth 2022-2028 | 48.18% | -0.12% | 10.27% | 20.32% |
(Source: FactSet Research Terminal.)
Nvidia’s free cash flow margins are expected to reach 50% in 2025. That’s 50 cents of every dollar in sales dropping straight to the bottom line.
Net margins of 54% (after taxes) by 2028 are just spectacular.
For context, here are some of the highest-margin businesses on earth.
YCharts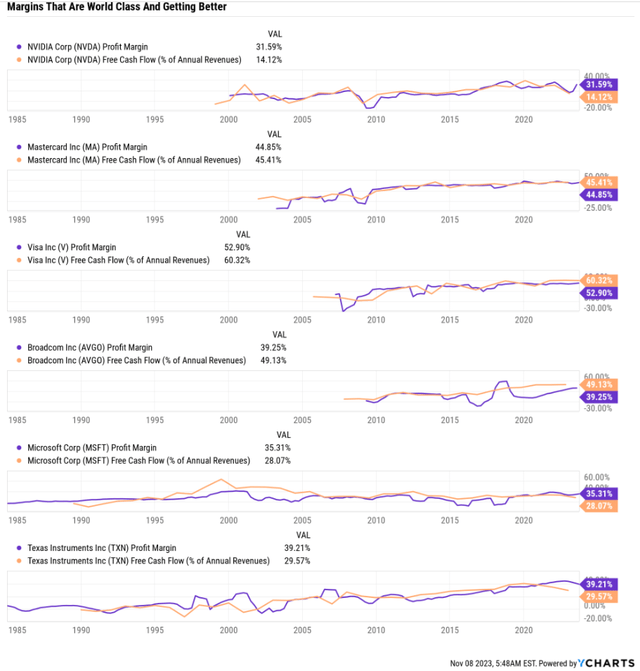
NVDA’s margins are expected to soar to the top 1% of all companies on earth.
Nvidia has a wide economic moat, thanks to its clear leadership in graphics processing units, or GPUs, hardware, and software tools needed to enable the exponentially growing market around artificial intelligence. In the long run, we expect tech titans to strive to find second-sources or in-house solutions to diversify away from Nvidia in AI, but most likely, these efforts will chip away at, but not supplant, Nvidia’s AI dominance.” – Morningstar.
Okay, so NVDA’s tech is the best in the world. But how can it possibly maintain that lead?
Ycharts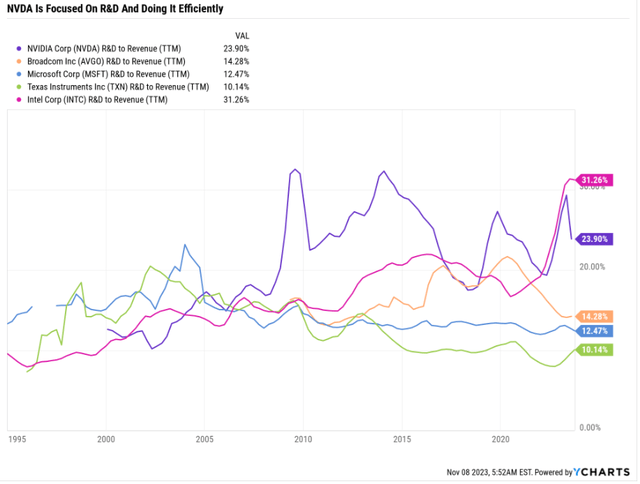
NVDA is spending far more on R&D than its peers, but the difference is that its doing it very efficiently.
We remain impressed with Nvidia’s prescient investments in GPUs, networking semis, and software, as the company spent the past decade (if not longer) laying the groundwork to emerge as the clear leader in AI training GPUs and associated software and tools. Like many chipmakers, Nvidia’s hefty R&D budget enabled the company to remain on the cutting edge of GPU design. Partnerships with Samsung and, increasingly, Taiwan Semi have enabled the company to release best-of-breed GPUs used in PC gaming. Yet the more impressive investments, in our view, was the less heralded work to develop the Cuda software platform, which includes the libraries, compilers, and development tools needed for engineers to deploy Nvidia’s GPUs in the data center for AI workloads. We now believe that Nvidia benefits from hefty switching costs in the data center. Even if AMD or another competitor could build a semiconductor comparable with Nvidia’s data center GPUs (such as the Hopper H100), we surmise that AI developers will stick with Nvidia because such AI models were built with Cuda.” – Morningstar (emphasis added).
CEO Jensen Huang is a mad genius founder of NVDA, and for 20 years, he’s been steering his company to where the puck is going.
He has seen the future, making smart, evidence-based forecasts that turn out right far more often than not.
On the M&A front, the deal that stands out is Nvidia’s acquisition of Mellanox Technologies for $6.9 billion in early 2020. Mellanox sells networking products that focus on efficient data transfer in data centers via its InfiniBand and Ethernet technologies for interconnects. Nvidia is reliant on these technologies in-house as well, using InfiniBand to build powerful DGX-integrated systems used for the heftiest of AI workloads.” – Morningstar.
NVDA’s M&A record is excellent, and that’s very tough to do in this sector.
And now that NVDA has become so much larger? How can it possibly keep growing rapidly when its sales are already $55 billion this year?
How can they possibly triple by 2028? This is just a chipmaker, for goodness sakes!
Ycharts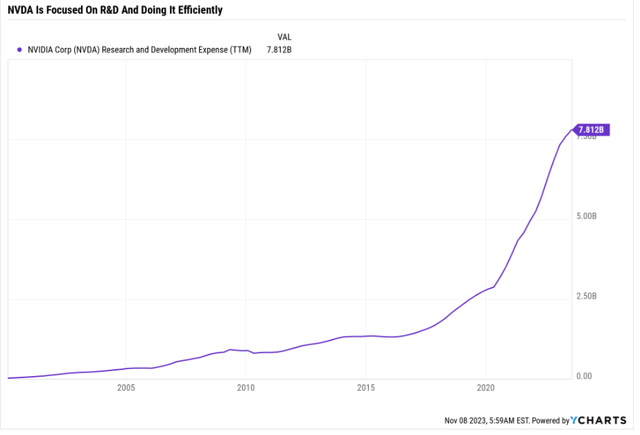
Remember that NVDA is spending 25% of sales on R&D. As sales rise, it can decrease that % of R&D spending to boost margins while still spending more on innovation and maintaining its 90% global market share in AI chips.
It won’t maintain that market share, of course, but who cares as long as sales and margins are rising?
Speaking of R&D and growth spending, here is the consensus forecast for NVDA.
NVIDIA Medium-Term R&D Consensus
| Year | SG&A (Selling, General, Administrative) | R&D | Capex | Total Growth Spending | Sales | Growth Spending/Sales |
| 2022 | $1,582 | $3,951 | $975 | $6,508 | $26,969 | 24.13% |
| 2023 | $1,740 | $5,406 | $1,833 | $8,979 | $52,317 | 17.16% |
| 2024 | $2,514 | $6,684 | $1,404 | $10,602 | $78,428 | 13.52% |
| 2025 | $3,222 | $8,937 | $2,133 | $14,292 | $93,390 | 15.30% |
| 2026 | $4,276 | $11,332 | $2,721 | $18,329 | $108,207 | 16.94% |
| 2027 | $4,297 | $15,610 | NA | $19,907 | $129,793 | 15.34% |
| 2028 | $3,027 | $18,605 | NA | $21,632 | $146,190 | 14.80% |
| Annualized Growth | 11.42% | 29.47% | 29.25% | 22.16% | 32.54% | -7.83% |
| Total Spending 2022-2027 | $19,076 | $66,574 | $8,091 | $93,741 | $608,325 | -2.77% |
(Source: FactSet Research Terminal.)
NVDA is expected to keep spending a steady 15% of sales on growth in the future, allowing for margin expansion while maintaining industry-leading levels of spending on innovation and maintaining its tech edge.
Last year it spent less than $7 billion on growth. By 2028, that’s expected to have tripled.
And more importantly, unlike someone like Intel, who can throw tens of billions into R&D for years with nothing to show for it. Or IBM with over 122,000 patents yet years of sliding sales, NVDA’s R&D efficiency is out of this world.
When NVDA spends $1 on growth, you can bet it knows what it’s doing.
Ycharts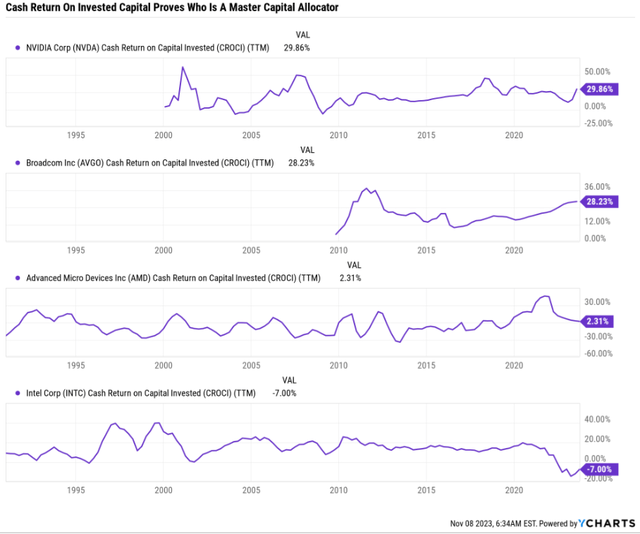
For every $1 it invests, NVDA generates 30 cents in free cash flow. That’s absolutely insane. 5% is considered decent, and double-digit is good. 15% is considered very good and 20% is outstanding.
NVDA (and AVGO) are run by mad genius CEOs who are truly world-beaters.
OK, so the forecast on NVDA are sensational, and it seems that buying today is a good way to earn potentially Warren Buffett-like returns over the coming years.
But how do we know we can trust those forecasts?
Reason 2: A Track Record Of Delivering On Blockbuster Growth Expectations
OK, so we’ve just seen how NVDA’s growth outlook has gone from good to great to out of this world.
But isn’t this a chip maker? And isn’t that a highly volatile industry?
Ycharts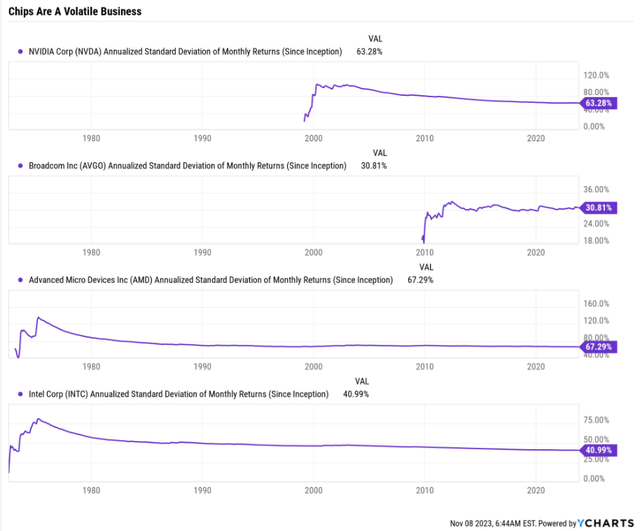
The S&P 500 (SP500) has 15% annualized volatility. That means in any given year, you should expect the market to fall 15% potentially, not because of recession or some crisis popping up, but just because that’s what U.S. stocks do.
Chip stocks are even more volatile, with Broadcom falling as much as 30% in any given year and NVIDIA as much as 63%.
Don’t forget about NVDIA’s historical bear markets, which are big crashes. That’s not scary; that’s normal and to be expected.
But here’s what happens with hyper-volatile hypergrowth Ultra SWANs like NVDA. From its worst bear market bottom in the last 20 years, take a look at the returns investors were able to achieve.
Best Rallies From Bear Market Lows Since 1999
| Time Frame (Years) | Annual Returns | Total Returns | S&P 500 Annual Returns | S&P 500 Total Returns |
| 1 | 751% | 751% | 56% | 56% |
| 3 | 140% | 1284% | 26% | 100% |
| 5 | 89% | 2340% | 23% | 180% |
| 7 | 81% | 6381% | 17% | 202% |
| 10 | 64% | 14165% | 17% | 361% |
| 15 | 43% | 20187% | 12% | 474% |
(Source: Portfolio Visualizer Premium.)
The best 15-year return from the S&P in the last quarter century, from bear market lows, was 474%, a solid 12% annual return.
The best 15-year return for NVDA was 43% per year, or turning $1 into $202.
Some people don’t like high volatility, and here’s why that’s not irrational.
JPMorgan Asset Management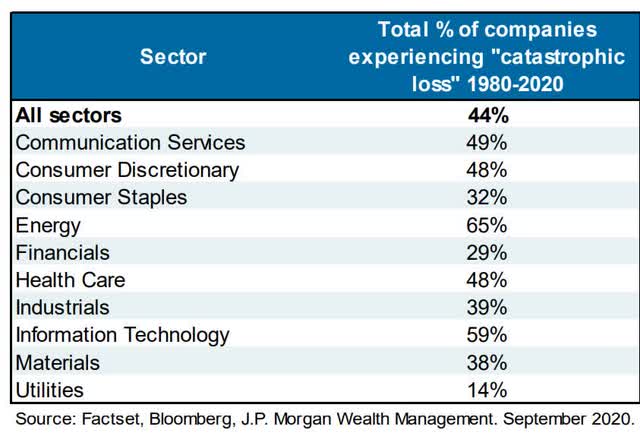
If a stock falls 70+%, chances are good it’s never going to recover no matter how long you hold, pray, and pretend things will be OK.
But for true world-beaters? Like NVDA? It’s a stock that has fallen as much as 87% from record highs and keeps coming back better than ever.
OK, but what about those insanely bullish forecasts for margins and cash flow growth? How accurate are those over time?
What’s the track record for management guidance and analysts’ estimates based on those guidance?
Here’s the data.
Seeking Alpha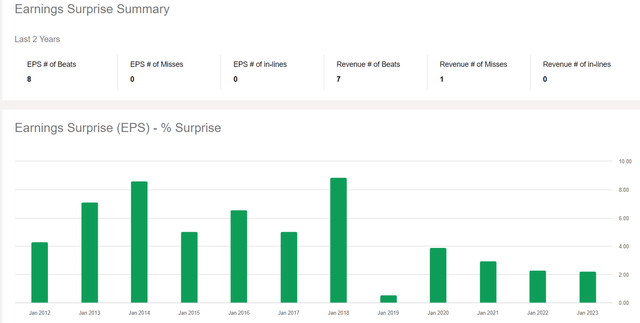
In 2 years, NVDA hasn’t missed earnings estimates once. Not even with estimates steadily climbing after each beat.
The bar keeps being raised, and it keeps clearing it with room to spare.
Seeking Alpha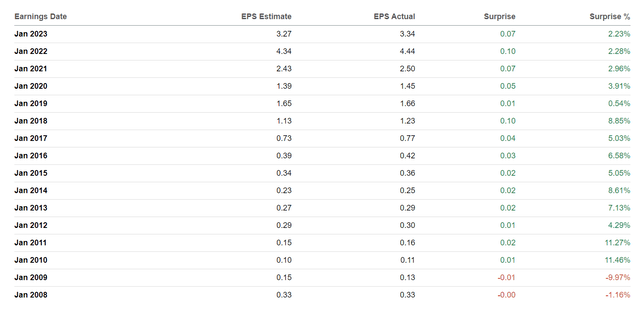
NVDA hasn’t missed earnings estimates in 14 years.
OK, but maybe those are just quarterly estimates that analysts lower ahead of time to let it beat by a few %?
FAST Graphs, FactSet FAST Graphs, FactSet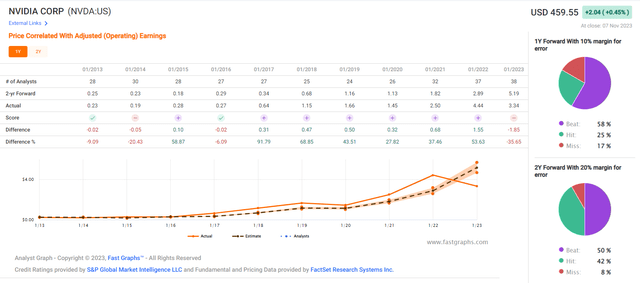
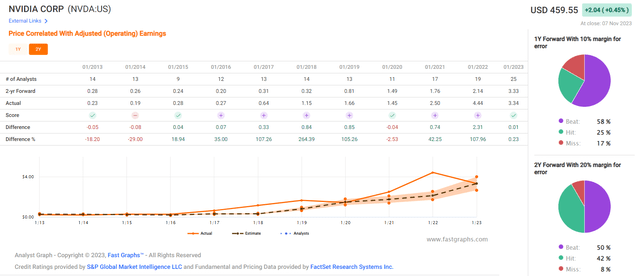
NVDA has only missed 1 year earnings estimates by 10% or more 17% of the time in the last 20 years, and over 2 years it has missed by 20% or more just 8% of the time.
Half the time its beating 2 year forecasts by over 20%.
The biggest 2-year miss was a 29% miss.
What about free cash flow? The most impressive growth metric NVDA has?
FAST Graphs, FactSet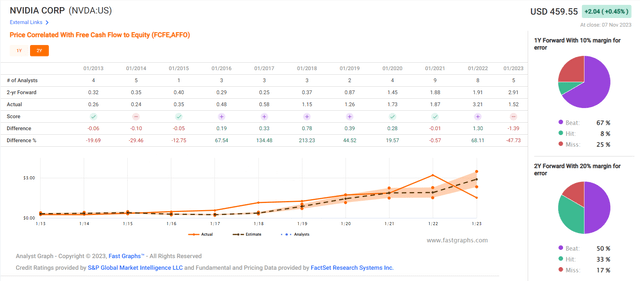
NVDA might be a hard-to-estimate chipmaker…except that management guidance is so good that it rarely disappoints.
Do you see a trend? It’s all about the management. Anyone (like Intel) can just throw lots of money at R&D, but it takes a mad genius like Jensen Huang to turn that R&D into science-based magic and engineering-fueled money-minting sorcery.
Reason 3: Excellent Long-Term Risk Management
There are no risk-free companies, and no company is right for everyone. You have to be comfortable with the fundamental risk profile.
Risk Profile Summary
We assign Nvidia with a Morningstar Uncertainty Rating of Very High. In our view, Nvidia’s valuation will be tied to its ability to grow within the data center and AI sectors, for better or worse. Nvidia is an industry leader in GPUs used in AI model training, while carving out a good portion of demand for chips used in AI inference workloads (which involves running a model to make a prediction or output).
We see a host of tech leaders vying for Nvidia’s leading AI position. We think it is inevitable that leading hyperscale vendors, such as Amazon’s AWS, Microsoft, Google, and Meta Platforms will seek to reduce their reliance on Nvidia and diversify their semiconductor and software supplier base, including the development of in-house solutions. Google’s TPUs and Amazon’s Trainium and Inferentia chips were designed with AI workloads in mind, while Microsoft and Meta have announced semiconductor design plans. Among existing semis vendors, AMD is quickly expanding its GPU lineup to serve these cloud leaders. Intel also has AI accelerator products today and will likely remain focused on this opportunity.
Our uncertainty rating is based on the uncertainty around this market. Nvidia dominates AI today and the sky is the limit for the company’s profitability if it can maintain this lead over the next decade. However, any semblance of the successful development of alternatives could meaningfully limit Nvidia’s upside.
Outside of the data center, Nvidia’s gaming business often faces boom-or-bust cycles along with PC demand and, more recently, the sharp rise and fall of cryptocurrency mining. Nvidia also has invested heavily in autonomous driving but again squares off against many other chipmakers (and automakers) for a piece of this pie with little guarantee of success.” – Morningstar.
Nvidia’s Risk Profile Includes
- Economic cyclicality risk: very high; earnings can fall as much as 82% in a severe recession
- M&A execution risk: brilliant CEO, but no one bats 1.000
- disruption risk: 50% free cash flow margins are going to attract an ocean of rivals
- regulatory risk: China tech ban could be a significant hit to future growth
- Key man risk: CEO is 60 years old and won’t be around forever
- currency risk
How do we quantify, monitor, and track such a complex risk profile? By doing what big institutions do.
Long-Term Risk Management Analysis: How Large Institutions Measure Total Risk Management
DK uses S&P Global’s global long-term risk-management ratings for our risk rating.
- S&P has spent over 20 years perfecting its risk model
- which is based on over 30 major risk categories, over 130 subcategories, and 1,000 individual metrics
- 50% of metrics are industry-specific
- This risk rating has been included in every credit rating for decades.
The DK risk rating is based on the global percentile of a company’s risk management compared to 8,000 S&P-rated companies covering 90% of the world’s market cap.
Nvidia scores 91st Percentile On Global Long-Term Risk Management.
S&P’s risk management scores factor in things like:
- supply chain management
- crisis management
- cyber-security
- privacy protection
- efficiency
- R&D efficiency
- innovation management
- labor relations
- talent retention
- worker training/skills improvement
- occupational health & safety
- customer relationship management
- business ethics
- climate strategy adaptation
- sustainable agricultural practices
- corporate governance
- brand management
- interest rate risk management.
NVDA’s Long-Term Risk Management Is The 79th Best In The Master List 84th Percentile In The Master List)
| Classification | S&P LT Risk-Management Global Percentile |
Risk-Management Interpretation |
Risk-Management Rating |
| BTI, ILMN, SIEGY, SPGI, WM, CI, CSCO, WMB, SAP, CL | 100 | Exceptional (Top 80 companies in the world) | Very Low Risk |
| Nvidia | 91 |
Exceptional |
Very Low Risk |
| Strong ESG Stocks | 86 |
Very Good |
Very Low Risk |
| Foreign Dividend Stocks | 77 |
Good, Bordering On Very Good |
Low Risk |
| Ultra SWANs | 74 | Good | Low Risk |
| Dividend Aristocrats | 67 | Above-Average (Bordering On Good) | Low Risk |
| Low Volatility Stocks | 65 | Above-Average | Low Risk |
| Master List average | 61 | Above-Average | Low Risk |
| Dividend Kings | 60 | Above-Average | Low Risk |
| Hyper-Growth stocks | 59 | Average, Bordering On Above-Average | Medium Risk |
| Dividend Champions | 55 | Average | Medium Risk |
| Monthly Dividend Stocks | 41 | Average | Medium Risk |
(Source: DK Research Terminal.)
NVDA’s risk-management consensus is in the top 14% of the world’s best blue chips and is similar to:
- Intuit: Ultra SWAN
- Bank of Nova Scotia: Ultra SWAN
- Medtronic: Ultra SWAN dividend aristocrat
- Alphabet: Ultra SWAN
- Caterpillar: Ultra SWAN dividend aristocrat.
The bottom line is that all companies have risks, and NVDA is exceptional at managing theirs, according to S&P.
How We Monitor Nvidia’s Risk Profile
- 54 analysts
- two credit rating agencies
- 56 experts who collectively know this business better than anyone other than management.
When the facts change, I change my mind. What do you do, sir?” – John Maynard Keynes.
There are no sacred cows here. Wherever the fundamentals lead, we always follow. That’s the essence of disciplined financial science, the math behind retiring rich and staying rich in retirement.
Bottom Line: 3 Surprising Reasons Nvidia Is Now A Good Buy
I know it also shocked me to discover that Nvidia is now a potentially good buy for anyone comfortable with its risk profile, including its penchant for 60% crashes.
But I’ve told you for years that I go wherever the fundamentals lead me.
There are no sacred cows.
When dividend aristocrats like Walgreens and 3M stumble, I warn you when dividend cut risk rises.
When Dividend Kings like VF Corp cut their dividends, I immediately start pounding the table about selling them.
Ycharts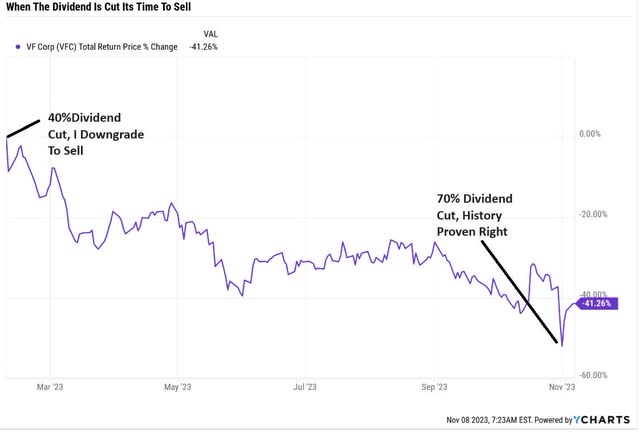
If Amazon screws up enough? I will tell you to sell it, and I’ll sell it myself.
If BTI’s wheels fall off the bus? I will tell you to dump it like trash that’s on fire.
My loyalty is to one thing only: the truth, as well as I know it.
I have the best data and the models to interpret it. I always tell you my best probability-based recommendations, and right now, the facts have changed on Nvidia.
It’s no longer a speculative mistake to buy it.
As long as you remember that it is a hyper-volatile Ultra SWAN, and Ultra SWAN has zero to do with volatility and everything to do with fundamental safety and quality.
If you are OK with a stock that will fall 60% in the future, even if the thesis is intact, then an appropriately sized NVDA buy today is reasonable, prudent, and disciplined financial science.
Read the full article here

