Any investor who has stuck with SolarEdge (NASDAQ:SEDG) over the last year or so has our respect – it’s been a tough stock to maintain conviction on for some time now.
Down almost 80% from 2021 highs, the stock has tumbled to new multi-year lows on the back of heightened interest rates, plummeting free cash flow, and continued dilution:
TradingView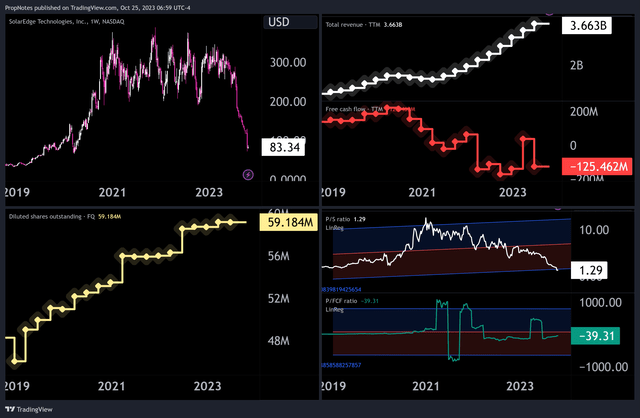
However, TTM top line sales have continued to grow, and solar (in general) continues to be a growth market. In that sense, there’s still some potential value to be found here, with the revenue multiple trading multiple deviations below and outside of the last 5 year’s linear regression, at only 1.29x sales.
Today, we’re going to take a look at the recent price action and the larger technical picture to get a sense of when the pain might end.
Plus, we’ll give long minded investors an idea for where a more ideal entry point might lie.
Sound good? Let’s dive in.
Price Structure
Any examination of a stock’s technical condition should always start with a review of the stock’s price structure.
In short, price structure refers to the way in which the stock has been trading; essentially describing how a stock is making new highs and lows.
If a stock is making higher highs and higher lows, then an uptrend is in effect. That looks a bit like this:
TradingView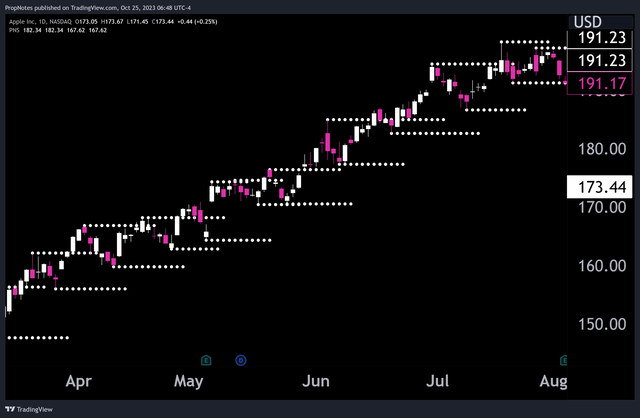
When a stock is making lower highs and lower lows, the situation is reversed, and the situation is typically labeled as a downtrend.
Alternatively, if a stock is making lower highs and higher lows, a serious consolidation is taking shape, and if a stock is making higher highs and lower lows one after the other, then there’s essentially no discernible range or direction to take advantage of.
Zooming out, SEDG’s price structure isn’t in favor of the bulls, as you may expect. After trading in a range for the last few years, the stock recently dove beneath recent support around the $200 mark, selling off to its current price point near $83:
TradingView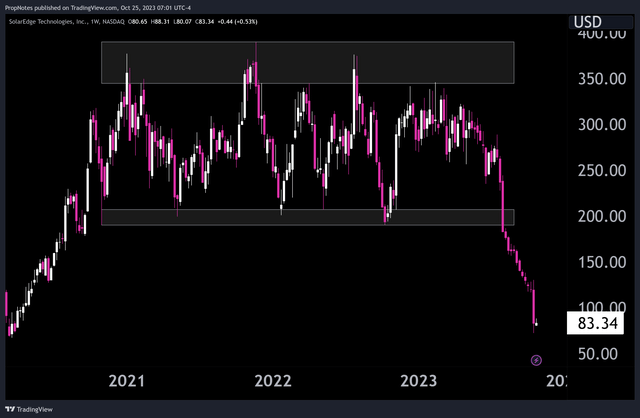
From a structural standpoint, this is obviously bearish, as sellers are firmly in control of this market.
However, the downtrend has been so sustained that a new swing low point hasn’t yet been established on the daily chart in the last ~5 months, which is quite a feat. It’s quite rare to see trends this strong, which raises questions about whether or not a bounce is ‘due’:
TradingView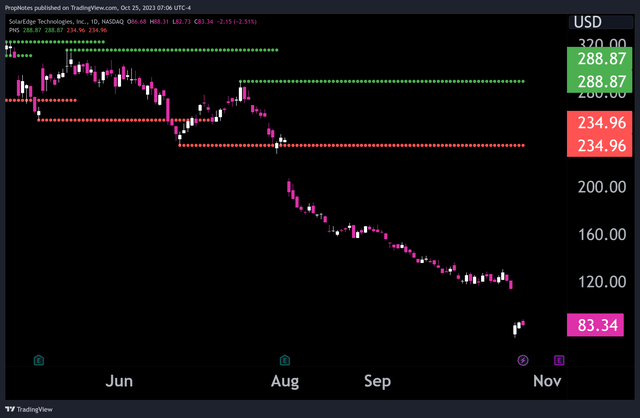
Mean Reversion
So, is the stock oversold and ready to bounce?
The RSI, or Relative Strength Index, would say ‘yes’:
TradingView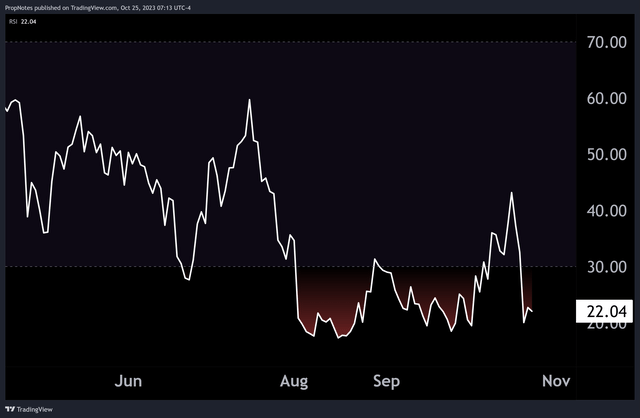
Currently reading an Oversold ’22’, the RSI appears to be trading firmly in ‘bounce’ territory.
Additionally, ADX, an indicator which measures the strength of a trend, is reading ~40, which is an incredibly high reading. With the ADX, a stock is typically considered “Trending” at readings above 25.
With a trend this strong, it’s not outrageous to think that such an extended condition may not persist for much longer.
However, these readings alone don’t imply that a bounce will come in the short term. Powerful trends can ‘trick’ these indicators, showing extreme figures for long periods of time as buyers, or sellers, in this case, persist.
Because of this lack of reliability, we invented an indicator for situations just like this; something we call the “Mean Deviation Detector”.
The goal of this indicator is to show how far a stock is trading away from what one may call ‘average pricing’ – essentially a combination of moving averages that describe the average price over the last x period of time.
Then, on top of that, we add a linear regression with standard deviation bands that describe the average ‘range’ around which price mostly stays.
This gives, in combination with the RSI, a real sense as to whether or not a stock is properly oversold and ready to mean-revert higher.
As you can see below from the blue reading on the bottom right of the frame, SEDG is trading at a 52% discount vs. ~average pricing over the last few months, which would typically be considered an excellent time to buy into a more stable company:
TradingView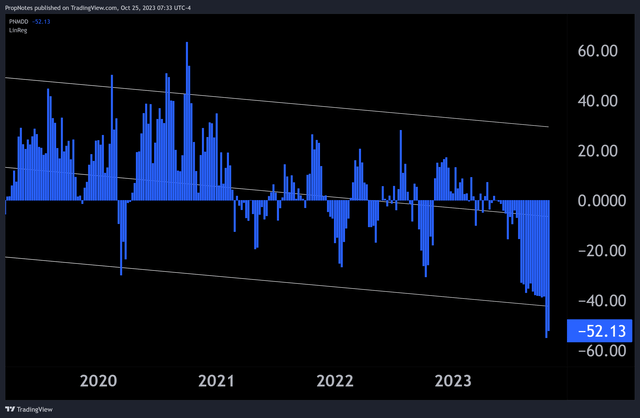
Additionally, you can see that this extended nominal reading is backed up by the fact that it’s trading outside of the double standard deviation bands in the white. This shows that the current price is ‘abnormal’, and clearly in territory that has become ‘interesting’.
Given that the sales multiple is also extended, we’re beginning to see increasing evidence that the selling is likely nearing exhaustion:
TradingView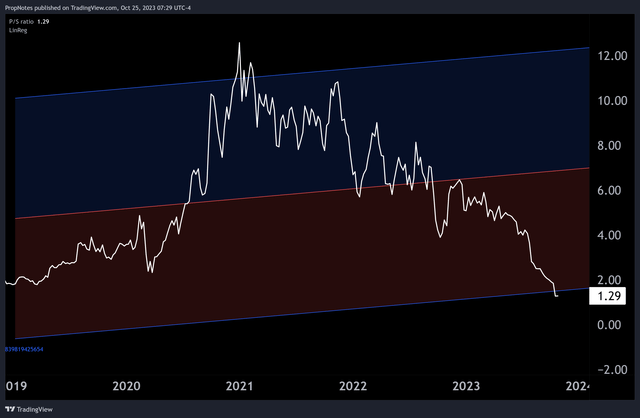
Where To Buy?
If the selling is nearing exhaustion, then does that mean that it’s the right time to buy?
Well, maybe. It depends on who you are.
You may have noticed that up to this point we haven’t touched on SEDG’s fundamentals, which would take up an entire additional article. Suffice it to say that to take advantage of what we’re about to say, you’re already thinking about getting long or adding to a position.
If you’re a long-term investor, then adding to your position now doesn’t appear to be a bad move at this point in time.
You may want to wait a little longer to see if price touches ~$70, which is the low that the stock reached during the Covid selloff in 2020:
TradingView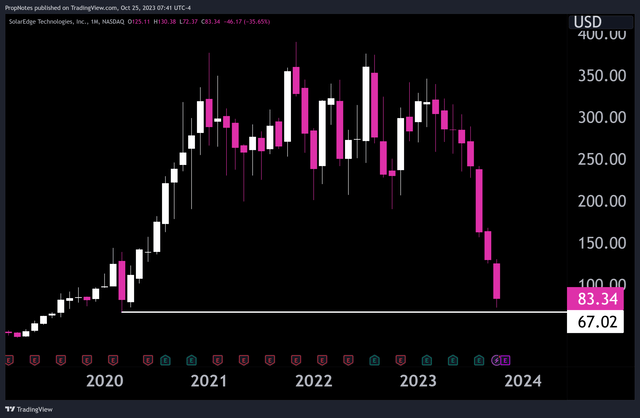
However, for all practical purposes, we’re already ‘there’. It’s tough to argue that this is a ‘bad’ price to add.
If you’re thinking about taking this as a shorter-term trade aiming to play a reversal in the trend, then buying blindly as the knife continues to fall may be a less profitable strategy for the short/medium term.
The smart way to play it would be to wait for a new range to establish itself on the daily timeframe, so that a breakout above that new range could provide:
- The necessary time for the market to digest the recent move, which should increase the odds of any long trade. (V-bottoms are rather uncommon in stocks like this with deteriorating margins)
- A better place to risk to. (Risking to the bottom of a recent range is much better than trusting a support level from several years ago)
Since we’re writing this from the perspective of a long investor expecting some improvement in the cash flow situation & looking to play the trend exhaustion, we rate SEDG a “Buy”.
In other words, we expect SEDG will be higher one year from now.
Risks
The key risk here is simply that the trend remains strong and blows through all of the usual measures of extension and mean reversion that we have. This isn’t common, but it’s certainly a possibility.
For commentary on fundamental risks, check out any of the other articles that have been penned on the topic here on Seeking Alpha, they’re all great.
Summary
All in all, we think SEDG is a buy given its extreme extension on multiple timeframes and lack of any new swing low pivot points.
Traders with shorter time horizons may want to wait for a new range to establish itself before taking the stock long to improve their changes, but long investors can consider the present price a solid deal from a technical perspective.
Enjoy this article? Be sure to follow us and check the notification box to hear about when we publish more like it.
Cheers!
Read the full article here

