A Quick Take On Skyward Specialty
Skyward Specialty Insurance Group, Inc. (NASDAQ:SKWD) provides specialty property & casualty insurance services in the United States.
I previously wrote about the firm’s IPO here.
The company is seeing a very favorable environment for its business segments while producing strong growth and profitability.
My outlook on SKWD is a Buy at around $27.00 per share.
Skyward Overview And Market
Texas-based Skyward Specialty Insurance Group provides commercial P&C insurance services as both a non-admitted (excess & surplus) or admitted insurance coverage provider.
The firm is led by CEO Mr. Andrew Robinson, who has been with the firm since May 2020 and was previously Co-CEO of Groundspeed Analytics and Chairman of Clara Analytics.
The company’s primary offerings include:
-
General liability
-
Excess liability
-
Professional liability
-
Commercial auto
-
Group accident and health
-
Property
-
Surety
-
Workers’ compensation.
According to a 2021 market research report by Insurance Business America, the E&S premium market in the U.S. market in 2020 was $41.7 billion.
This growth was a 14.9% increase over the 2019 result of $37.5 billion.
The primary reasons for this growth were a low-interest rate environment, increased claims costs, and increasingly frequent weather events, among others.
These factors are forecasted to remain evident in the near future, with the topic of ransomware potentially becoming a more important factor in many insurance policies.
Major competitive or other industry participants include:
-
Markel Corporation
-
W.R. Berkley Corporation
-
American Financial Group
-
Tokio Marine Holdings
-
CNA Financial
-
Hiscox, Ltd.
-
AXIS Capital Holdings
-
RLI Corp.
-
Intact Finance Corporation
-
Argo Group International Holdings
-
Kinsale Capital Group
-
James River Group Holdings.
Skyward’s Recent Financial Trends
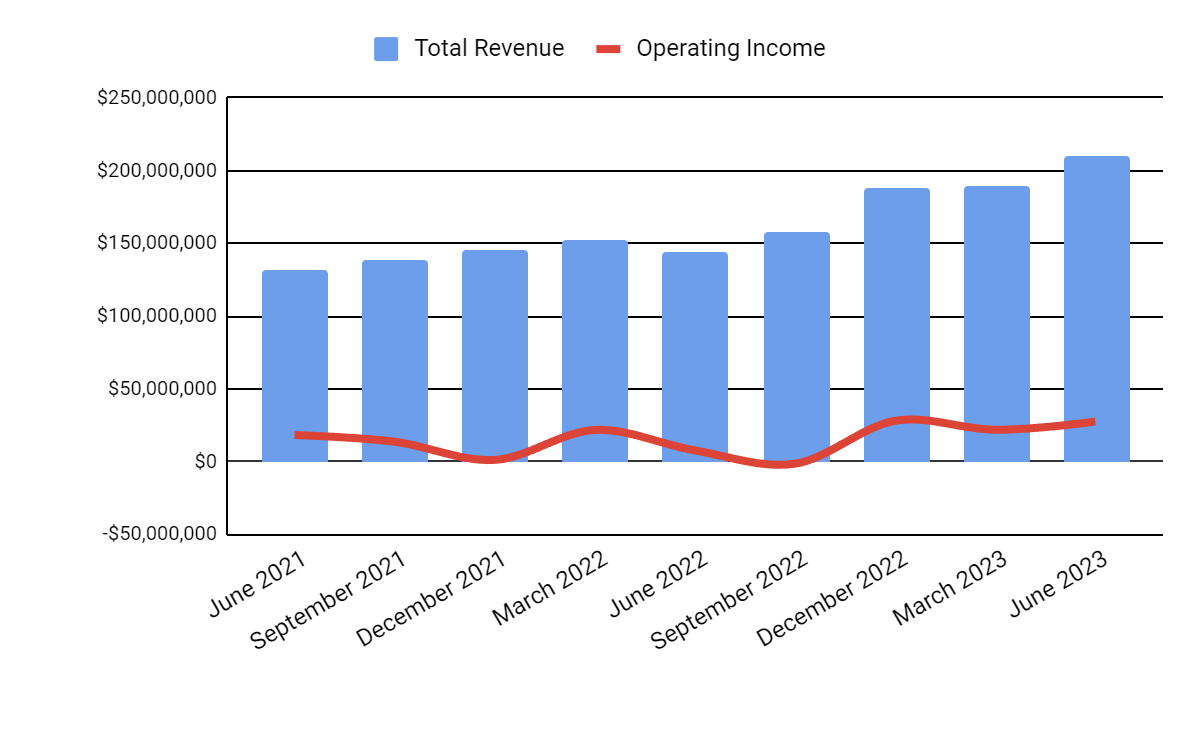
Total revenue by quarter has risen markedly in recent quarters; Operating income by quarter has varied within a narrow range recently.
Seeking Alpha
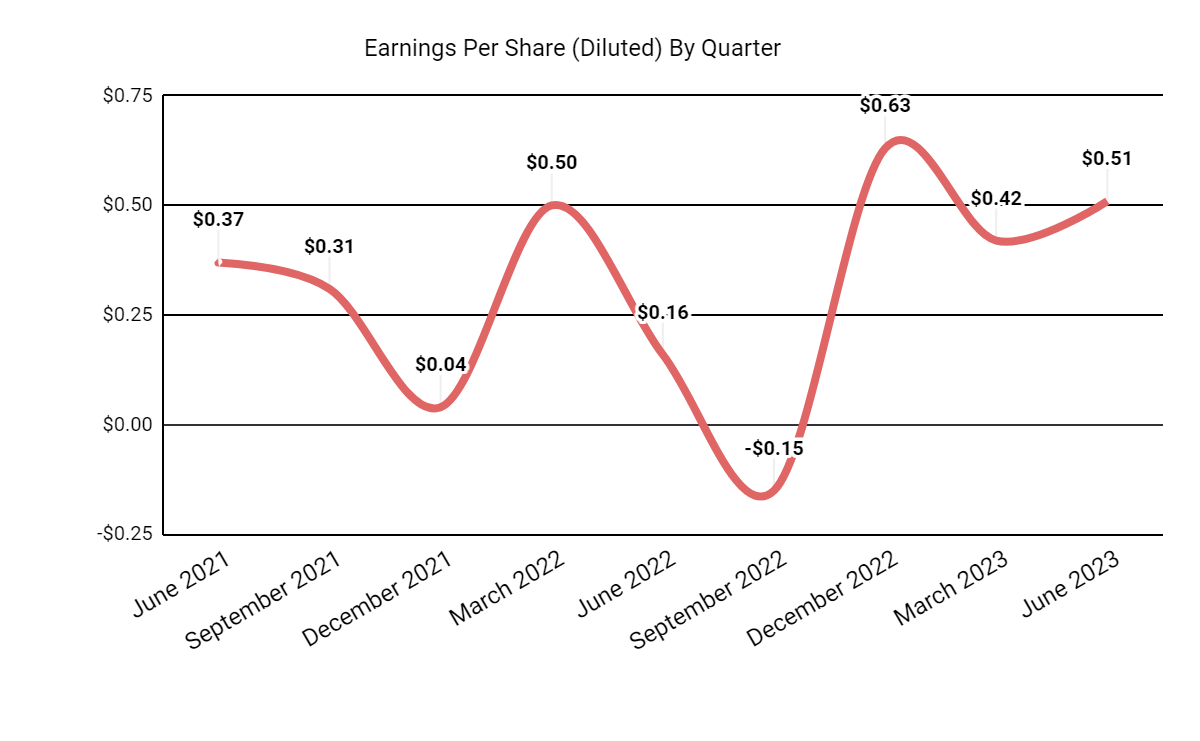
Earnings per share (Diluted) have produced greater variability but higher highs in recent quarters.
Seeking Alpha
(All data in the above charts is GAAP.)
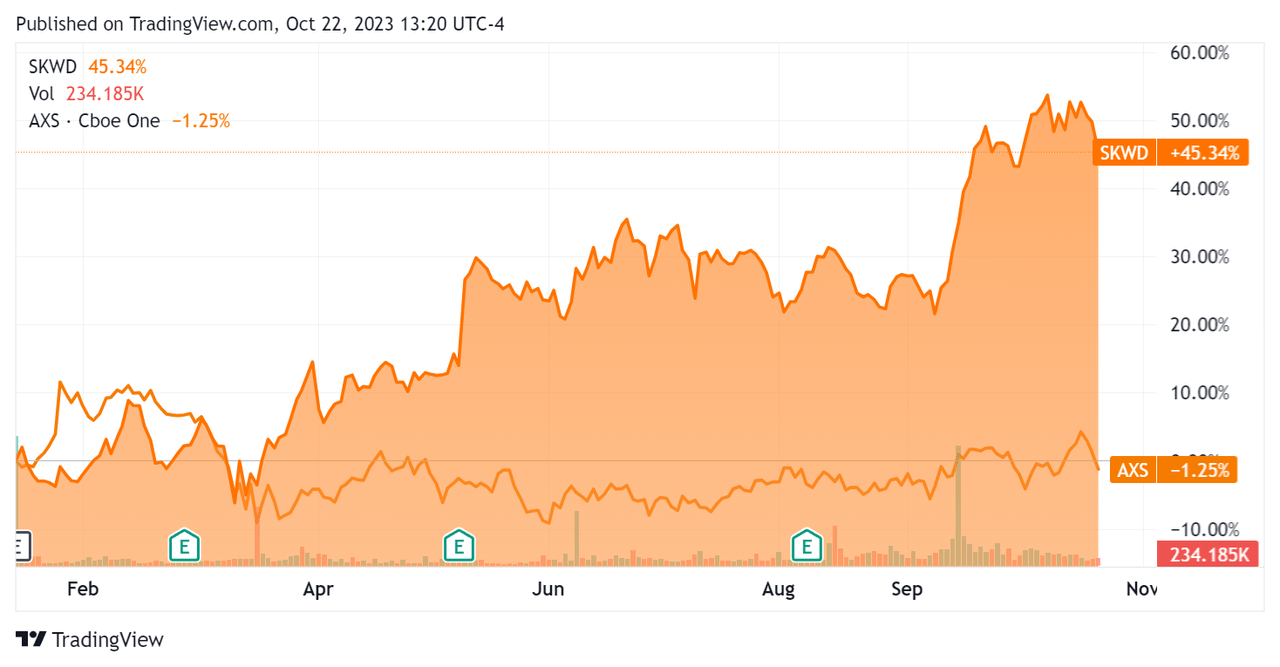
In the past 12 months, SKWD’s stock price has risen 45.34% vs. that of AXIS Capital Holdings’ (AXS) fall of (1.25%), as the chart shows below:
Seeking Alpha
For balance sheet results, the firm ended the quarter with $1.29 billion in investments, $67.5 million in cash and equivalents, and $69.5 million in long-term debt.
The firm’s book value per share was $13.87 as of June 30, 2023.
Over the trailing twelve months, free cash flow was $250.4 million, during which capital expenditures were $3.0 million.
Valuation And Other Metrics For Skyward
Below is a table of relevant capitalization and valuation figures for the company:
|
Measure (Trailing Twelve Months) |
Amount |
|
Enterprise Value / Sales |
1.5 |
|
Enterprise Value / EBITDA |
13.8 |
|
Price / Sales |
1.0 |
|
Revenue Growth Rate |
28.5% |
|
Net Income Margin |
7.1% |
|
EBITDA % |
10.8% |
|
Market Capitalization |
$1,050,000,000 |
|
Enterprise Value |
$1,110,000,000 |
|
Operating Cash Flow |
$253,400,000 |
|
Earnings Per Share (Fully Diluted) |
$1.41 |
|
Free Cash Flow Per Share |
$9.74 |
(Source – Seeking Alpha.)
As a reference, a relevant partial public comparable would be AXIS Capital Holdings:
|
Metric (Trailing Twelve Months) |
AXIS Capital |
Skyward Specialty |
Variance |
|
Enterprise Value / Sales |
1.1 |
1.5 |
41.0% |
|
Enterprise Value / EBITDA |
9.8 |
13.8 |
41.4% |
|
Revenue Growth Rate |
4.1% |
28.5% |
595.1% |
|
Net Income Margin |
6.9% |
7.1% |
3.8% |
|
Operating Cash Flow |
$779,530,000 |
$253,400,000 |
-67.5% |
(Source – Seeking Alpha.)
Commentary On Skyward
In its last quarterly filing (Source – Seeking Alpha), management calculated its annualized return on tangible equity, which has improved substantially in 2023 versus 2022’s results, as the table shows below:
Seeking Alpha
Total gross written premium revenue for Q2 2023 rose sharply, by 29.4% year-over-year.
Operating income almost quadrupled YoY, reaching $27.5 million in Q2 2023 versus $7.7 million in Q2 2022.
Looking ahead, consensus revenue estimates for 2023 are $836 million, or top line growth of 30.1%.
If achieved, this would represent a sharp increase in revenue growth rate versus 2022’s growth rate of 17.9% over 2021.
As for valuation metrics, the company’s forward P/E ratio is 15.77x, versus the industry median of 8.99x, for a premium of over 75% to its peers.
Also, the firm does not pay a dividend, whereas the industry median trailing twelve-month yield is around 4.15%.
Despite these less-than-favorable aspects, a secondary offering of 3.85 million shares of the firm’s stock in June was met with no negative price reaction from the market, suggesting a continued strong appetite for the company’s stock.
Management has pointed to its extremely low catastrophic losses as to the broader industry.
New business pricing “remains in line with our in-force book,” so the company is not seeing much in the way of pricing pressures.
Each of the firm’s divisions is delivering at or above its minimum target capital return hurdle rates.
And, management believes the new business that is coming onto the books with fuel margin expansion.
Given the demand for the firm’s diversified products, expected gross margin improvements and stock demand, my outlook on Skyward Specialty Insurance Group, Inc. is a Buy at around $27.00 per share.
Read the full article here

