Investment update
The market’s confidence in Premier, Inc.’s (NASDAQ:PINC) investment prospects are at their lowest in 10 years after a difficult fiscal ’23 and a tighter economic outlook in the coming years. Since my May publication, the company has continued to sell lower.
PINC’s fiscal ’23 numbers were largely behind consensus expectations. Investors have punished the company as a result. It has travelled lower in continuation of the longer-term downtrend observed since mid ’22. Perhaps more problematic, there’s no fiscal ’24 guidance provided as part of the company’s “strategic alternatives”. Per the earnings call:
As previously announced, given our Board and the management team’s ongoing evaluation of potential strategic alternatives, we are not providing our fiscal 2024 outlook or other formal guidance at this time.”
To me, this wreaks of a company that has also lost confidence in the predictability of its cash flows. Deeper analysis of the company’s economics reveals why this is potentially so. This report will unpack these economic value factors in greater detail, whilst analyzing key price action to guide price visibility looking forward.
Net-net, I was interested in PINC at these levels and here I’ll present both the upside and downside case for PINC to either rally or continue its selloff. In my view, any returns are for the short-term investor, given the tight multiples only. Still, for investors of all time horizons, searching for more selective opportunities may be best. Net-net, I continue to rate PINC a hold on these factors.
Figure 1. PINC long-term price evolution, weekly price change
Data: Updata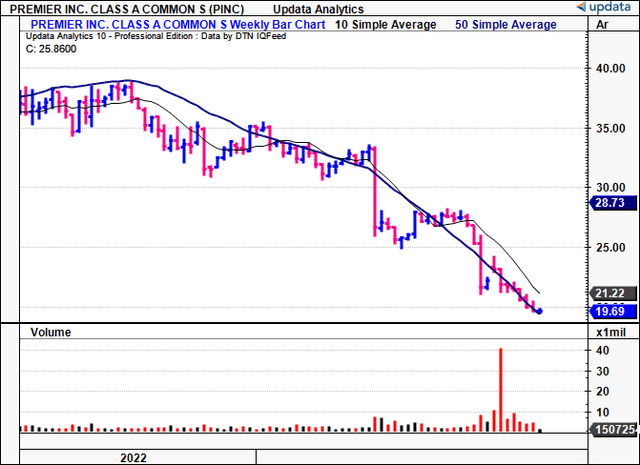
Critical factors to reiterated hold thesis
1. FY’23 numbers
PINC booked FY’23 revenues of $1.43Bn on adj. EBITDA of ~$500mm, a YoY decline of ~$290mm at the top line. Despite this, it clipped a 31% core EBITDA margin, tracking back to long-term range (Figure 2). On this, it threw of $264mm in FCF.
Two critical factors within its unit economics stand out:
- Group purchasing organisation (“GPO”) retention ratio was again at 98%, two points ahead of the 3-year average,
- Software-as-a-service (“SaaS”) institutional renewal rate came in at 94, ~100bps behind the 3-year average.
BIG Insights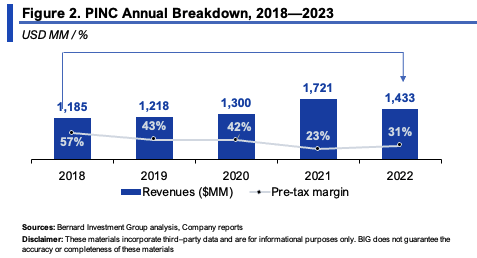
PINC will make one change to its reported numbers next year and I feel it’s worth noting here. It will no longer “include equity earnings from [its] minority investments in our adjusted EBITDA“, following the change in its FFF Enterprises investment last fiscal year. It will therefore recognize a lower adj. pre-tax income in its fiscal ’24, so you’d be best served paying close attention to operating cash flow.
On that front, the company’s 10-year historical OCF is shown in Figure 2a. It remains only slightly elevated above the 10-year average, and has shown no growth for 2 years, with cash flow margins of ~15% of sales. It isn’t collecting higher cash receipts from customers nor is it investing additional growth capital into the business. Hence, it has burnt through plenty of cash in the last decade.
BIG Insights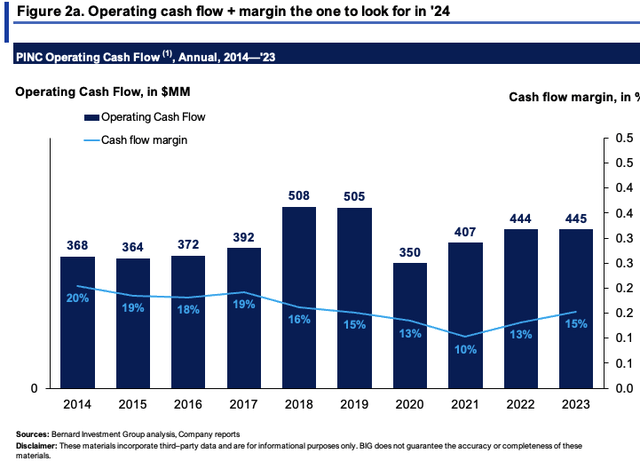
As to the economics and capital productivity of the business, PINC is a reasonably high margin, low capital turnover business. It derives its economic value from its c.20% post-tax margins, meaning it enjoys consumer advantages (99% of c-suites the company surveyed in FY’23 said they were content with PINC’s service) and likely prices its offerings above the industry average to reflect this.
Unfortunately though, two stingers to the equity investor standout:
(i). No growth in FCF/share, nor in earnings produced off capital invested,
(ii). The company’s high earnings rate on capital at risk is not a function of profit growth. Rather, it is the result of producing flat NOPAT on a declining capital base. So the 16–18% rate of return on capital is a misnomer—there’s been no profit growth from a decade ago, and the company has had to trim back asset intensity to support itself in my opinion.
To evidence this, it has created just $888mm of economic earnings when applying a 12% threshold to the return on its invested capital, ~5-6% of sales. That being, it created $888m of economic value for its shareholders when compared to the market’s long-term average returns.
BIG Insights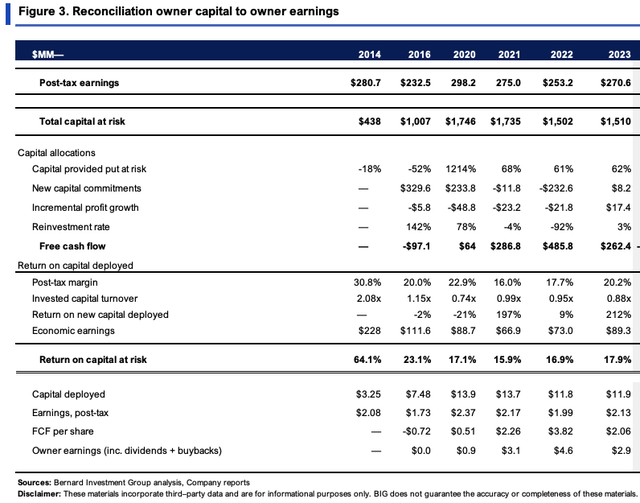
2. Price implied expectations
The market has reasonably flat expectations for PINC, but will pay no premium to buy the company today.
To explain:
- Selling at $19.70/share at 8.73x forward earnings implies the market expects $2.26/share in earnings in FY’24, ~9.7% YoY decline.
- Using the same logic, it expects $301.5mm in pre-tax income and $1.35Bn in revenues. It has therefore priced PINC to produce no growth in fiscal ’24.
- This explains the sharp selloff across CY 2023, indicating PINC’s growth prospects are limited along with is capital gains.
- Interestingly enough, to compensate for the risk in buying PINC, the market only requires a rate of return of 6.5–15% depending on various inputs (Figure 4). In my opinion, this is a function of (i) the low prices to be paid [8.7x forward earnings is a 51% discount to the sector], and (ii) that it has a degree of certainty in its conviction on PINC’s earnings + dividends.
This is an interesting set of data that could point to an upset for bearish investors should PINC outpace these expectations. The questions are 1) can it surprise against these expectations? and 2) if so, what’s the catalyst?
My estimation is that there is a 50/50 chance it can surprise (we’ve no guidance as well, remember—but the company revised its numbers down 2x last year, let’s not forget this), and the catalyst would therefore be purely fundamental, i.e., an improved sales and earnings outlook over the next 3 years.
BIG Insights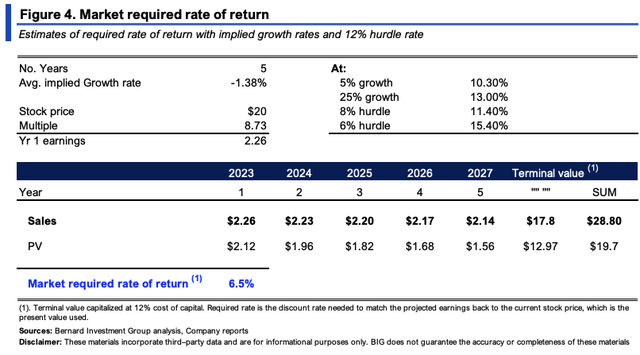
3. Technicals for price visibility
A combination of fundamental and technical outlook is required to fully analyze PINC’s investment prospects.
There are several points related to price distribution and objective price targets:
(1). Across the last 3 quarters, the company has formed a new pocket of usage and looks to have nearly completed the distribution from $21–$23. The question is, will it spend more time here, to make the distribution tighter? Or will it form breadth back to the upside/downside?
(2). Markets tend to use from areas of high usage to low usage. You can see the pocket of low usage in Figure 5 above the area we are currently bogged in. If it were to fill the superior pocket, what we don’t have is information on when, so it comes back to PINC needing a firm catalyst to see demand flood in again.
Figure 5.
Data: Updata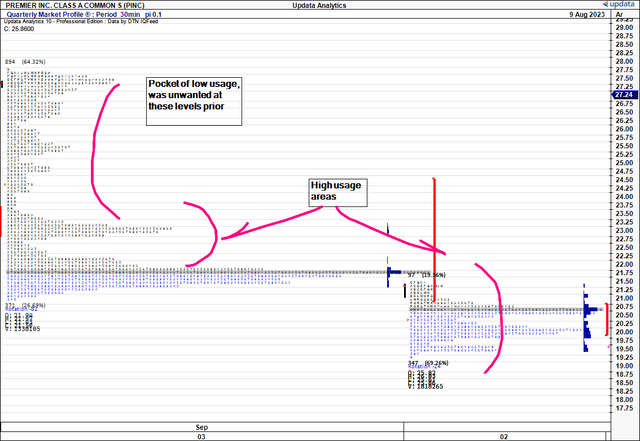
(3). What we do have is some price visibility over the coming weeks of trade, and from what it seems, we can expect further downsides to $13 then $7.75 if the current trend prevails. I am looking to these targets in the point and figure studies below with detail as they have eyed the levels well in the recent periods. A further selloff could certainly see us push to these levels of $13 in my opinion.
Figure 6.
Data: Updata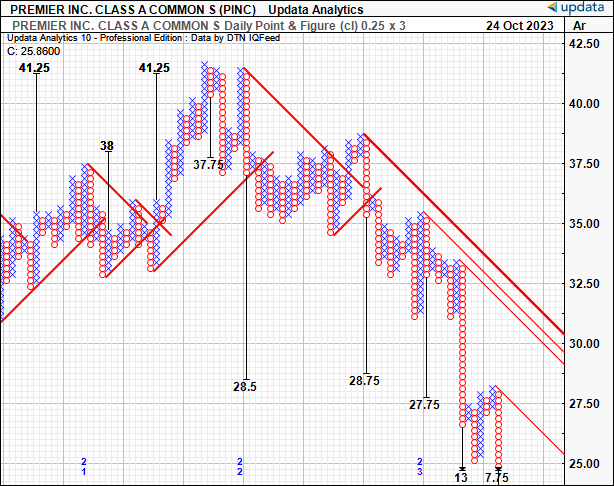
Evidence for a reversal is also weak at the time of writing. On the daily cloud chart (Figure 7), there are notable features to discuss:
- The gap down in August was not filled, and the marabuzo line of this candle rests at 61.8 on the Fibs. The marabuzo line on subsequent deep candle was taken out with a gap higher before a shooting star top in early September and subsequent reversal.
- It has since displayed a number of continuation patterns, the latest in mid October, with an evening star shown below extending the down-leg.
- It all depends on whether PINC has found a bottom at its current levels or not. If it has, there is scope for the stock to rally to $23.75, a 50% retracement and the rough top of the cloud.
- But we’ve no evidence of that just yet, so the next weeks will be critical. Resistance at $23 then $22 on this frame.
Figure 7.
Data: Updata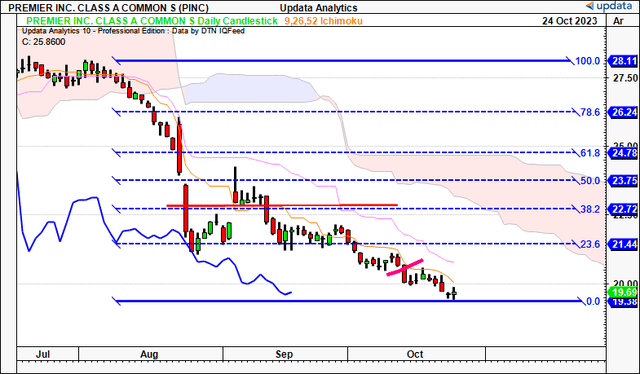
On the weekly, looking to the coming months, You’ll see the cross below the cloud back in CY 2022, with 3x tremendous selloffs after trading in congestion. On two of these, the marabuzo line has not been retaken, and now serves as two key levels at the 23.6% and 50% retracements on the fibs. The latest plunge wasn’t met, resulting in a continuation of the downtrend in H2 2023. Again, the scope for a reversal on this setup is limited, but a 50% retracement would be $33.25 at the time of writing.
Figure 8.
Data: Updata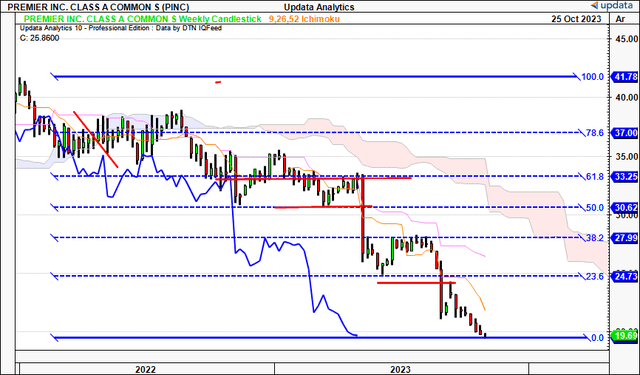
Valuation and conclusion
There are conflicting arguments in the debate for PINC’s value at the time being. These include the following:
- Market expected returns are low for the company, despite a low required rate to compensate for the risk,
- Such compressed multiples do enhance the 12-month forward returns an investor can harvest, trading off such a low base.
- However, 1–3 years returns are hindered by the company’s lacklustre sales and earnings growth outlook.
- Beyond this (3–5 years), the company’s business returns on capital at risk are masked by the fact it’s been reducing asset density for several years. Hence, profits haven’t grown, business capital has just been divested.
- Technically, we’ve no evidence of a reversal from technical indicators, but key levels are attractive should it begin to turn.
So there’s no support to enter on any of the three time horizons in my opinion. Further, we have to respect the market’s appraisal of the company as it has been a good judge of the company’s intrinsic value over the last decade, as seen below. PINC arguably is trading back at fair range following its sharp pullbacks in 2022 and 2023.
Therefore the evidence to expect differently from the market is also hard to find. So I find it’s fairly valued at $2.5–$3Bn.
BIG Insights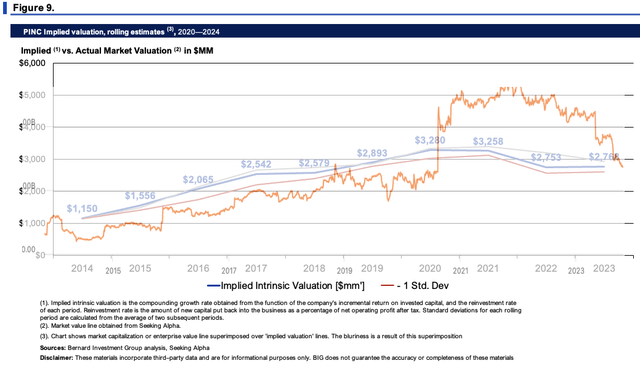
In short, there are multiple challenges to rating PINC as an investment grade company at this stage. The market’s expectations are low, meaning cheap multiples, but these may very well be justified. Prospective returns over a short to long-term horizon are biased to the short-term, and even then, the company would need a fairly decent catalyst to see it jump higher. Net-net, I continue to rate PINC a hold at $2.5–$3Bn enterprise value.
Read the full article here

