Investment Thesis
WisdomTree U.S. Total Dividend Fund (NYSEARCA:DTD) warrants a hold rating due to multiple risk factors for the fund. While DTD has seen strong performance compared to peers, comparable ETFs have seen roughly the same capital appreciation with a higher dividend yields and lower expense ratios. Additionally, DTD is heavy on mega-cap information technology companies which has resulted in a relatively high valuation for the fund with increased risk of correction and volatility.
Fund Overview and Compared ETFs
DTD is a passively managed fund that seeks to track the WisdomTree U.S. Dividend Index. This index is dividend weighted but does not necessarily put the greatest weight in the highest dividend paying companies. With its inception in 2006, the fund has 827 holdings and $1.23B in AUM. DTD is heaviest in the information technology sector at 18.89%, followed by financials (18.46%) and consumer staples (11.86%). DTD includes predominantly (91.87% weight) on large cap, U.S. holdings.
While numerous dividend ETFs exist, other popular dividend funds examined for comparison purposes are Schwab U.S. Dividend Equity ETF (SCHD), Vanguard High Dividend Yield ETF (VYM), and Amplify CWP Enhanced Dividend Income ETF (DIVO). In contrast to DTD, SCHD has only 8.7% weight on information technology. VYM seeks to capture companies forecasted to produce above average dividend yields. VYM is the largest fund compared with over $67B in AUM. DIVO also has lower weight in information technology and is the least diversified ETF compared with only 36 holdings.
Comparing DTD and Peers: Performance, Fees, and Dividend Yields
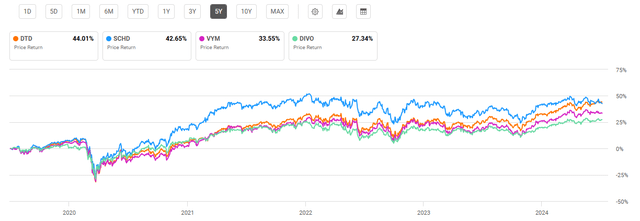
The newest fund compared, DIVO, was created in 2016. Therefore a 5-year lookback was used for comparing funds. DTD’s average annual 5-year return was 11.85%. By comparison, SCHD has a 5-year annualized return of 13.36% and DIVO has an annualized 5-year return of 11.19%. VYM saw the weakest performance with a 5-year average annual return of 9.76%. Of course, this is only considering the share price of each fund. I will discuss the combined impact of dividend yields and expense ratios later which must also be considered. Despite solid performance, all funds have underperformed the S&P 500 Index over the past five years which has seen a 5-year average annual return of roughly 15%.
5-Year Total Price Return: DTD and Peer Dividend-Focused Funds (Seeking Alpha)
DTD’s fees are lower than DIVO’s at 0.28%. However, Schwab and Vanguard tie for the lowest expense ratios at just 0.06%. A key objective for all funds is an above average dividend yield. While DTD’s dividend yield of 2.24% beats the overall market, as measured by the S&P 500 Index, it is lower than all other compared ETFs.
Expense Ratio, AUM, and Dividend Yield Comparison
|
DTD |
SCHD |
VYM |
DIVO |
|
|
Expense Ratio |
0.28% |
0.06% |
0.06% |
0.56% |
|
AUM |
$1.23B |
$54.47B |
$67.18B |
$3.26B |
|
Dividend Yield TTM |
2.24% |
3.67% |
3.00% |
4.58% |
|
Dividend Growth 5 YR CAGR |
3.86% |
12.88% |
5.81% |
2.88% |
Source: Seeking Alpha, 5 Jul 24
DTD Holdings and Key Outlook Factors
DTD is the most diversified fund compared with over 800 holdings. However, DTD holds the heaviest weight on the largest tech companies such as Microsoft (MSFT), Apple (AAPL), and NVIDIA (NVDA). While some of SCHD’s top holdings such as Cisco (CSCO) and Texas Instruments (TXN) in the IT sector as well, they have more favorable valuations along with higher dividend yields.
Top 10 Holdings for DTD and Peer Dividend ETFs
|
DTD – 827 holdings |
SCHD – 103 holdings |
VYM – 556 holdings |
DIVO – 36 holdings |
|
MSFT – 3.34% |
CSCO – 4.11% |
JPM – 3.53% |
MSFT – 5.49% |
|
AAPL – 3.31% |
HD – 4.05% |
AVGO – 3.45% |
UNH – 5.30% |
|
JPM – 2.97% |
TXN – 4.04% |
XOM – 3.21% |
JPM – 5.00% |
|
AVGO – 2.64% |
CVX – 4.04% |
PG – 2.34% |
CAT – 4.98% |
|
XOM – 2.60% |
AMGN – 4.04% |
JNJ – 2.13% |
PG – 4.91% |
|
NVDA – 2.31% |
ABBV – 4.01% |
HD – 2.02% |
GS – 4.89% |
|
ABBV – 2.11% |
LMT – 4.00% |
MRK – 1.92% |
HD – 4.85% |
|
JNJ – 1.93% |
BLK – 4.00% |
ABBV – 1.72% |
V – 4.84% |
|
PG – 1.76% |
VZ – 3.97% |
WMT – 1.70% |
AAPL – 4.30% |
|
CVX – 1.66% |
KO – 3.95% |
BAC – 1.66% |
HON – 4.06% |
Source: Multiple, compiled by author on 5 Jul 24
Looking forward, I see multiple drawbacks for DTD. A key factor is DTD’s relatively heavy weight on the information technology sector. This difference has only exacerbated in the past few months. The second consideration is that DTD lags peers when also considering dividend yield and expense ratio in addition to share price performance. Both these considerations are discussed further below.
Concern #1: Heavy on IT Sector
The first potential disadvantage for DTD is its weight on the information technology sector. I have followed DTD since April this year and noted that back then the fund was heaviest in the financial sector at 18.25%, followed by information technology (17.45%) and consumer staples (12.11%). Currently, DTD has almost 19% in the IT sector. Comparatively, SCHD and VYM hold only 8.7% and 10.1% weight in IT respectively. In recent years, this heavier weight has served DTD well. The IT sector has seen over 40% return over the past year with a 5-year return of 207%. Meanwhile, the broader S&P 500 Index has yielded a 24% one-year return and 85% five-year return. This five-year difference is depicted below.
Comparative Performance of IT Sector vs. S&P 500 Index (Yahoo Finance)
However, this disparity in performance has resulted in high P/E for several top mega-cap, big tech holdings. Over the trailing twelve months, price-to-earnings ratios for the largest tech companies by market cap have reached high points. Averaging the P/E ratios for the top five holdings for DTD, SCHD, and VYM, we see a significantly higher valuation for DTD’s top holdings, driven by the IT sector’s recent performance.
|
DTD (weight) |
P/E Ratio |
SCHD (weight) |
P/E Ratio |
VYM (weight) |
P/E Ratio |
|
MSFT (3.34%) |
39.93 |
CSCO (4.11%) |
15.90 |
JPM (3.53%) |
12.60 |
|
AAPL (3.31%) |
34.51 |
HD (4.05%) |
22.36 |
AVGO (3.45%) |
76.03 |
|
JPM (2.97%) |
12.60 |
TXN (4.04%) |
30.99 |
XOM (3.21%) |
14.09 |
|
AVGO (2.64%) |
76.03 |
CVX (4.04%) |
14.43 |
PG (2.34%) |
26.79 |
|
XOM (2.60%) |
14.09 |
AMGN (4.04%) |
44.15 |
JNJ (2.13%) |
21.48 |
|
Average |
35.43 |
Average |
25.57 |
Average |
30.20 |
Source: Multiple, compiled by author on 5 Jul 24
Examining historic trends, there is reason to have concern about the IT sector, dominated by mega-cap growth companies. Earlier this year, the Russell 1000 Growth Index saw a P/E ratio 36% above its average seen since 2000. By comparison, the Russell 2000 Value Index had a P/E 26% below its average since 2000. Therefore, DTD’s emphasis on the IT sector with a high P/E for top holdings presents a liability for the fund compared to peers.
Concern #2: Incorporating Expense Ratios and Dividend Yields
The second key area for concern is DTD’s expense ratio and lower dividend yield compared to peers. While its 0.28% expense ratio is lower than DIVO’s, it is notably more expensive than SCHD and VYM. This 0.22% difference can add up over the long run. Additionally, DTD has a lower dividend yield than both SCHD and VYM. This combined effect of average return, expense ratio, and dividend yield can be listed in the table below. Assuming a constant dividend yield over the past five years, DTD lags both SCHD and DIVO.
|
DTD |
SCHD |
VYM |
DIVO |
|
|
5-year Average Annual Return |
11.85% |
13.36% |
9.76% |
11.19% |
|
Expense Ratio |
0.28% |
0.06% |
0.06% |
0.56% |
|
Dividend Yield |
2.24% |
3.67% |
3.00% |
4.58% |
|
Average Total Return with Dividends minus Expenses |
13.81% |
16.97% |
12.70% |
15.21% |
Source: Multiple, compiled by author, 5 Jul 24
We can then conclude that while DTD has strong 5-year performance, its low dividend yield sets the fund behind other comparable ETFs. Given DTD’s heavier information technology focus, an investor would need to see stronger capital appreciation to make up for its lower dividend yield. While this has been true over the past five years, mega-cap IT’s high valuation is at risk of a correction as previously discussed.
Current Valuation
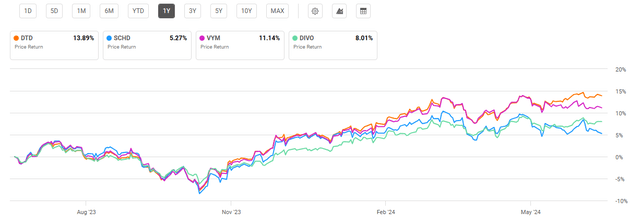
As a result of DTD’s relatively high concentration in the information technology sector, the fund has seen the strongest performance over the past year at 13.9%. However, this has also driven its valuation to be relatively high compared to peer funds. At 19.90, DTD has the highest price-to-earnings ratio.
One Year Performance: DTD and Compared Dividend ETFs (Seeking Alpha)
Looking forward, it appears that DTD is at risk for the greatest correction in the event of a downturn. While the fund has a lower P/E than the broader market, as measured by the S&P 500, its tech-focus represents a liability for the fund. Based on the below P/E and P/B ratios, I see significant risk in DTD’s ability to sustain its growth. Given its lagging dividend yield and higher expenses than SCHD and VYM, a correction in the IT sector will prove highly problematic for DTD.
Valuation Metrics for DTD and Peer Competitors
|
DTD |
SCHD |
VYM |
DIVO |
|
|
P/E ratio |
19.90 |
16.21 |
18.50 |
15.85 |
|
P/B ratio |
3.46 |
3.10 |
2.60 |
3.64 |
Source: Compiled by Author from Multiple Sources, 5 Jul 24
Risks to Investors
DTD’s performance comparative to peers likely hinges on the performance of mega-cap IT. Since May 1, 2024, the information technology sector’s forward price-to-earnings ratio has increased 19% from 26 to 31. Therefore, there is risk that IT valuations are increasing at a rate greater than their own earnings growth. Of course, a significant risk to my own thesis is that a correction back to historic average does not occur and large IT such as Microsoft, Apple, and NVIDIA continue to far exceed the rest of the market. One key variable is the expected reduction in interest rates by the U.S. Federal Reserve. As we saw since 2008, low interest rates have a strong fueling effect to large-cap growth companies. A reduction of the federal funds rate to 1.75% to 2.00% by the end of 2026 could mean that DTD outshines peer dividend ETFs, despite its high valuation.
Concluding Summary
DTD has demonstrated a historic trend of solid performance with a dividend yield that beats the S&P 500 Index. However, the fund has gravitated towards mega-cap, IT companies in its top holdings which has resulted in a high valuation for the fund. As an alternative, SCHD and VYM have higher dividend yields, lower expense ratios, and more attractive valuations due to their lower IT weight. Looking back 20 years, large cap growth has become overvalued while small cap value has become undervalued. A return to historic averages will drive DTD to underperform comparable dividend-producing funds.
Read the full article here

