Overview
Sixth Street Specialty (NYSE:TSLX) lending operates as a business development company that focuses on lending to middle market companies that are primarily US-based. The BDC has a public inception dating back to 2014, so we have over a decade of historical performance and portfolio strategy to reference. I previously covered TSLX back in February and rated it as a buy despite the price trading at a premium to net asset value. I randomly referenced some peer BDCs to compare the total return profile over the last three-year period. As we can see, TSLX is a middle of the pack performer and has achieved a total return of over 30% over the last three years.
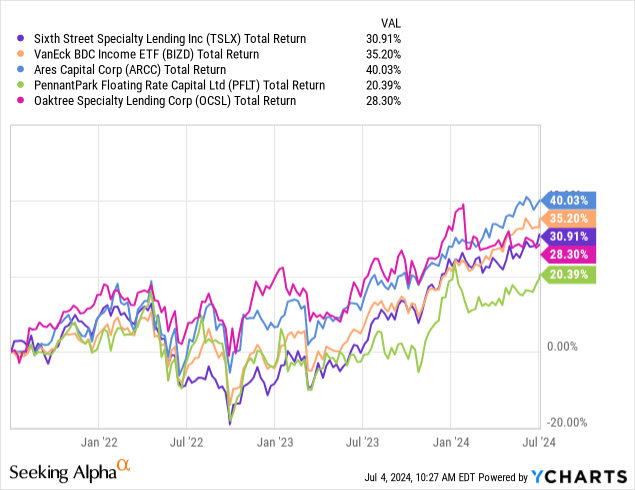
This positive total return can be attributed to the BDC’s high distribution rate of about 8.8%. As an added bonus, this high distribution has remained fairly consistent over the last five years, as TSLX managed to fully cover it with strong earnings. Seeing whether or not a BDC’s dividend trajectory remains affected by the pandemic is a pretty solid indicator of how well constructed and managed the portfolio of investments is. The good news is that TSLX’s distribution history is fairly consistent and the presence of supplemental dividends make this a strong choice for investors looking to compound the income generated from their portfolio.
TSLX is externally managed by Sixth Street Specialty Lending Advisors and has a management fee of 1.45% of assets. The price continues to trade at a similar premium to NAV level from my initial coverage. Therefore, I believe that now would be a good time to accumulate for long-term holders due to the strength, strategy, and diversity of their debt investment portfolio. Let’s first start by reviewing the details of what makes TSLX’s portfolio so well constructed.
Portfolio Strategy
Since the focus remains on middle market companies, the average position size in any investment typically ranges from $20M to $105M. Most borrowers are US-based, but there is some exposure to European borrowers. Something that stands out to me is that TSLX’s portfolio appears to be cyclical resistant, as the portfolio at fair value has grown at a very consistent rate over the last decade. Investments at fair value now amounts to approximately $3.38B, but a decade ago fair value amounted to only $1.19B.
A big part of TSLX’s portfolio is to remain diverse and mitigate any concentration risk to any one specific industry or sector. We can see that business services remain the largest industry exposure now accounting for 17% of the total portfolio. This is followed by exposure to Internet Services and Human Resources Support Services, making up 15.1% and 10.8% respectively. The top ten borrowers account for approximately 22% of the overall portfolio, which now encompasses about 124 individual portfolio companies within.
TSLX Q1 Presentation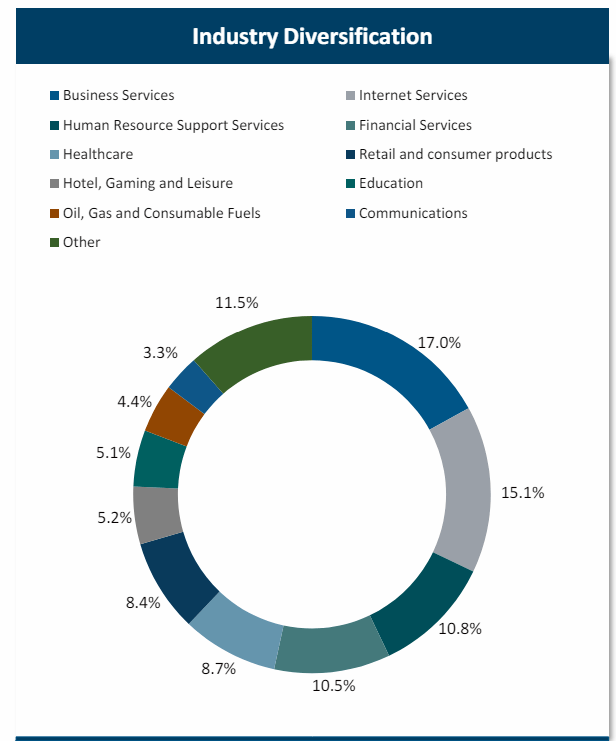
Sticking with a focus on risk mitigation, I like the fact that a majority of the portfolio is structured as first lien debt investments. As of the latest quarter, 92% of their investments are on a first lien senior secured basis. Senior secured debt sits at the top of the corporate capital structure, which means that this form of debt has the utmost highest priority for repayment. This offers protection in scenarios where a portfolio company may be going through a bankruptcy and is forced to liquidate assets because it helps to ensure that not all invested capital is lost.
Similarly, over 99% of TSLX’s investments are made on a floating rate basis. This means that as interest rates rise, TSLX is able to rake in higher levels of income through increased interest payments from borrowers. However, the opposite concept is also true in cases where interest rates start to get cut. Decreasing interest rates would mean that TSLX’s net investment income may get negatively impacted and shrink.
Financials & Risk Profile
Keeping interest rates in mind, we can also see how the Federal Funds rate has an effect on the price of TSLX. When rates were cut to near zero levels in 2020 following the pandemic, the price of TSLX started to rapidly move upwards as this created a more favorable environment for borrowers. Companies were able to acquire debt at much more attractive rates, and it was relatively cheap to hold debt. As a result, TSLX started to grow in price as the volume of borrowers increased and presented an opportunity for rapid growth in new investments across different industries.
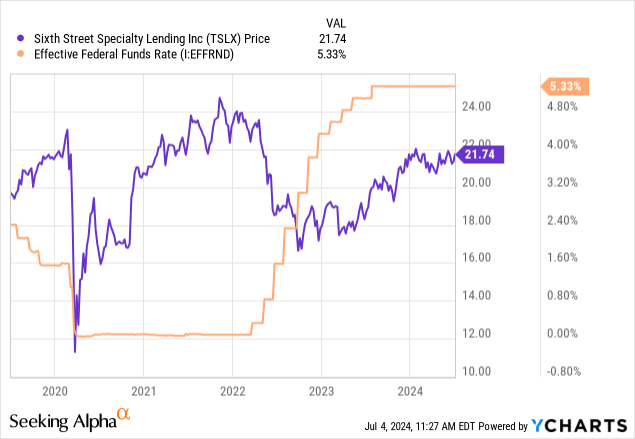
Conversely, we can see that when interest rates started to rapidly rise in 2022, the price of TSLX reacted to the downside before eventually stabilizing. Higher rates make the environment for borrowers less attractive, as it now means that it’s more expensive to maintain floating rate debt on your balance sheet. However, this is beneficial for TSLX as they can effectively pull in higher levels of income from their borrowers. At the same time, though, this may create some additional risk as higher rates may cause strain on some borrowers as the higher debt maintenance costs chew into profit margins.
Their latest Q1 earnings were reported in early May and the results came in under expectations but still relatively solid. I mention the interest rate vulnerability because I believe that these cracks are starting to show. For example, net investment income per share landed at $0.53, which is a decrease from the prior year’s Q1 NII of $0.65 per share. The net investment income per share has trended downward for two consecutive quarters now.
TSLX Q1 Presentation
This isn’t necessarily bad, though, when we consider that the adjusted net investment income per share is pretty aligned with prior quarters. The prolonged period of higher interest has amounted to a slight uptick in non-accruals, however. Non-accruals are portfolio companies that are significantly underperforming and can no longer keep up with the required debt payments. This means that this is the percentage of companies that are no longer contributing to TSLX’s net investment income. At the moment, non-accruals sit at 1.1% of the portfolio by fair value. This is relatively healthy when comparing it to peer BDCs of a similar size.
- Morgan Stanley Direct Lending (MSDL): 0.4% non-accrual rate at cost.
- Oaktree Specialty Lending (OCSL): 2.4% non-accrual rate at fair value.
- Main Street Capital (MAIN): 0.5% non-accrual rate at fair value.
While non-accruals give us a sense of how much risk is involved with the BDC, I do not think that the current level is a cause for concern. I dug back to the earnings call for Q1 of 2020 to see that the non-accrual rate at that time was 0.1% at fair value, which was extremely low. Now that the interest rates environment is totally different from 2020, the rise in non-accruals is pretty understandable.
As a way to gauge the quality of their investments, TSLX uses an internal rating system that operates on a numbered scale between 1 and 5. A rating of 1 represents the highest quality investment, while a rating of 5 represents the most underperforming investments. Management’s underwriting ability is reinforced by the success and high quality of their investments, with 91% of the portfolio sitting at a rating of 1 and 5% of the portfolio sitting at a rating of 2. While the reporting doesn’t transparently list the remaining percentages, a majority of 96% of their portfolio sitting at a 1 or 2 rating is a strong testament to the portfolio quality.
TSLX Q1 Presentation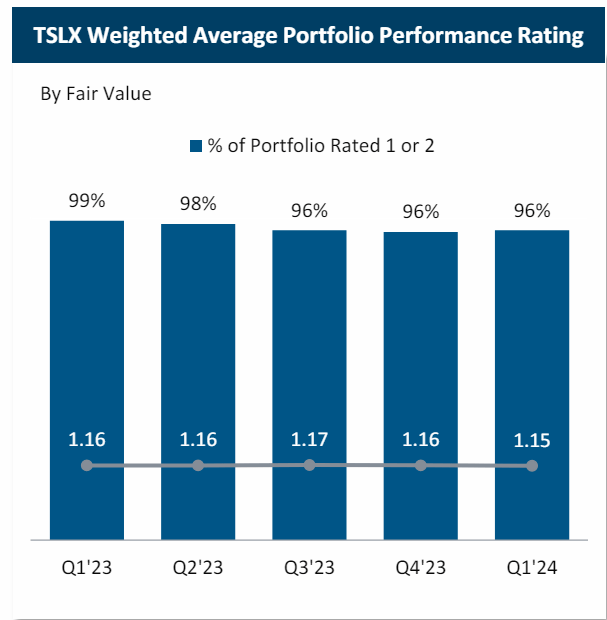
Lastly, it’s reassuring to see that TSLX continues to prioritize making investments that will ultimately grow their portfolio. New investment commitments totaled $263M over the quarter. This was allocated towards 9 new portfolio companies at an average investment size of about $24M. The average term of these new investments was just over six years, which contributes to TSLX’s continued long-term stability. Liquidity remains solid even though cash and equivalents only total $6.8M because of their much larger undrawn credit facilities totaling $1.1B.
Dividend
As of the latest declared quarterly dividend of $0.46 per share, the current dividend yield sits at about 8.8%. Despite the starting yield sitting so high, the dividend growth since inception has been quite solid, with base increasing averaging a CAGR (compound annual growth rate) of 3.4% since inception about a decade ago. Not only has the dividend growth been solid, but the distribution also remains well-supported by the net investment income. As mentioned, net investment income for the quarter landed at $0.53 per share. This means that the distribution is covered by NII by approximately 115.2%.
This coverage is even stronger when we use the adjusted net investment income of $0.58 per share as a reference. This would indicate that adjusted NII covers the distribution by approximately 126%. This combination of distribution coverage and growth makes TSLX an attractive dividend compounder when held with a long-term outlook. Using Portfolio Visualizer, we can see how the dividend growth from a $10,000 investment would have played out over the last decade. This graph assumes that you also added a fixed contribution of $500 every single month, while also reinvesting all dividends that were received.
Portfolio Visualizer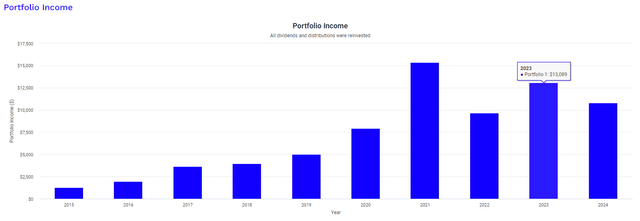
In 2015, your annual dividend income would have been $1,255. Fast forwarding to 2023, and we see that this amount would have grown to $13,089 through a combination of consistent reinvestment and base dividend raises. However, it’s worth mentioning that the dividend income received from TSLX is classified as ordinary dividends. Ordinary dividends are typically taxed at less favorable rates than the qualified dividends you’d receive from more traditional dividend growth stocks. Therefore, a position of TSLX may be best utilized in a tax advantaged account depending on your situation.
Valuation
In terms of valuation, TSLX is able to trade at a different price than what the underlying net assets are worth since it operates as a business development company. Therefore, we can see that TSLX trades at a premium to NAV of about 26.7%. This is pretty aligned with the 26.05% premium level that TSLX traded at when I last covered the stock. For reference, the price has traded at an average premium to NAV of about 22.85% over the last three-year period, which means that the current premium is a bit higher than its average range.
CEF Data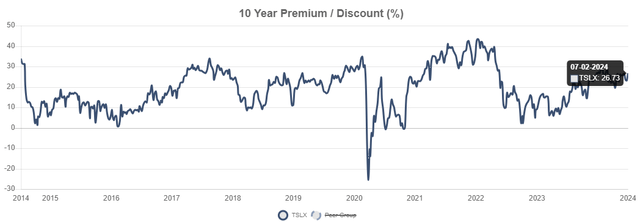
However, the quality underwriting and diversity of the portfolio which yields solid net investment results help justify this premium pricing. Additionally, we can see that the premium frequently traded between the 20% to 30% range over the last decade, so this isn’t unusual. If interest rates come down, we will likely see the volume of borrowers increase, which creates an ideal condition for new investment activity. This can contribute to additional NAV growth over time, as management has a proven track record of being able to adapt to different economic cycles.
Wall St. analysts seem to agree with this consensus based on the average price target. There is currently price target sits at an average of $22.64 per share. This represents a very modest potential upside of 4% from the current price level. However, I believe that most of the value here is in the sustainability of the high distribution, and we’ve already established that net investment income covers it with a healthy margin. Therefore, I maintain my buy rating on TSLX.
Takeaway
In conclusion, TSLX’s portfolio has proven that it resists any cyclical vulnerabilities as performance has remained consistent, and the distribution has remained intact. Net investment income per share comfortably covers the high-yielding distribution rate, and a history of base rates make this a great option for investors looking to prioritize income from their portfolio. Additionally, the continued performance may enable future distribution raises, which add to the compounding ability of TSLX. Their portfolio of debt investments remain structured in a way that mitigates risk by focusing on senior secured debt and a floating rate basis. Valuation suggests that TSLX trades at a premium, but this is well justified by the fund’s consistent performance and management’s strong underwriting abilities that have helped keep non-accruals low.
Read the full article here

