If everybody indexed, the only word you could use is chaos, catastrophe… The markets would fail.”
– John Bogle, May 2017.
Introduction
The last article I published on Nvidia Corporation (NASDAQ:NVDA) was authored in August of 2020, and since that time frame, there has been a further boom in 2021, a bust that bottomed in 2022, with Nvidia’s share price declining from around $345 per share at its 2021 peak, to around $108 per share at its 2022 lows, and a boom again in 2023 that has morphed into a “late 1999 and early 2000” style party and mania early in 2024.
The boom-bust cycle of a cyclical leader in cyclical space should be clear. However, today, investors are looking past all caution signs that historically come with this cyclicality and embracing the new all-time highs in Nvidia’s share price.
Heading into a much-anticipated earnings report on February 21st, I took a deeper dive into Nvidia once again. I came away even more cautious than my contrarian nature predisposed me to be.
Why?
Looking under the surface reveals valuation metrics that put even the late 1990s large-cap leaders to shame.
While valuation has not been a good predictor of returns thus far for Nvidia stock, investors should be aware of the historical risk that today’s starting valuation metrics are implying, in order to make an informed investment decision.
Nvidia Valuation Is Historically Stretched, Even Compared To 2000s Large-Cap Leaders
Nvidia at a market capitalization of $1.73 trillion at yesterday’s close is trading at 64 times 2023’s revenue of roughly $27 billion, so a 64 price-to-sales ratio. Nvidia’s trailing twelve months’ price-to-sales ratio is roughly 39. On Seeking Alpha’s 2024 sales estimates of $59 billion, which is the average analyst estimate for sales in 2024, NVDA shares are trading at a 29 price-to-sales multiple. On Seeking Alpha’s 2025 average revenue estimates of $94 billion, NVDA shares trade at a roughly 19-time price-to-sales multiple on 2025 earnings.
Will revenue growth take another step up when Nvidia reports its earnings on February 21st, 2024, after the market close? That is possible, however, the bar is already set very high.
On that note, and taking into account the price-to-sales multiples listed above, consider this famous quote from Scott McNealy circa 2002.
“At 10 times revenues, to give you a 10-year payback, I have to pay you 100% of revenues for 10 straight years in dividends. That assumes I can get that by my shareholders. That assumes I have zero cost of goods sold, which is very hard for a computer company. That assumes zero expenses, which is really hard with 39,000 employees. That assumes I pay no taxes which is very hard. And that assumes you pay no taxes on your dividends which is kind of illegal. And that assumes with zero R&D for the next 10 years, I can maintain the current revenue run rate. Now, having done that, would any of you like to buy my stock at $64? Do you realize how ridiculous those basic assumptions are? You don’t need any transparency. You don’t need any footnotes. What were you thinking?”
Scott McNealy.
For perspective, Sun Microsystems’s market price peaked at a market capitalization above $200 billion, and Sun was ultimately acquired by Oracle (ORCL) for $7.4 billion, or $5.6 billion net of cash in April of 2009.
For further perspective, and to close the loop from the opening paragraph, NVDA trades at a price-to-sales ratio today of over 39 today on a trailing twelve-month forecast. Even on 2024 and 2025 estimates, the price-to-sales multiples are off the charts of Scott McNealy’s famous quote. Read that quote again, and think how excessive and stretched the valuation multiples are today for Nvidia.
Simply put, price-insensitive and valuation-insensitive investors combined with momentum investors chasing performance have driven NVDA shares to an unsustainable extreme. Similar to the prior peak in late 2021, except this time the extreme is even greater. The downside is the other side of this even steeper mountain, and is going to be more treacherous on the way down. This time, passive market indices like the Invesco QQQ Trust ETF (QQQ) and the SPDR® S&P 500 ETF Trust (SPY), where NVDA shares are roughly 4.6% and 4.0% of each ETF’s exposure respectively, are even more awash with expensive technology exposure.
A Parabolic Move
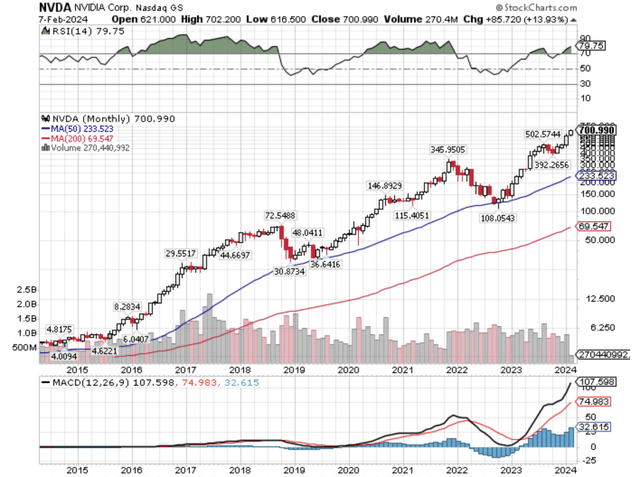
Look at the monthly chart of NVDA below, focusing on the 2021 peak and decline, and the recent surge upwards.
NVDA Monthly (Author, StockCharts)
Investors easily forget that there have been previous booms and busts in NVDA shares, including in 2018. Then there was the aforementioned 2021 peak, where NVDA shares declined from a high of roughly $345 per share to $108 per share, as the enthusiasm around cryptocurrency mining and technology stocks crumbled at the same time.
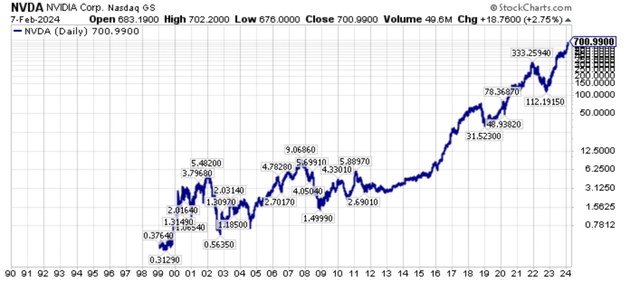
Looking at a longer-term price chart of NVDA shares illustrates an even more parabolic move.
NVDA Long-Term (Author, StockCharts)
Thinking back through market history, Cisco Systems (CSCO), especially circa 1996-2000, is the closest parallel for Nvidia, in my opinion. Investors should be aware that investing in CSCO shares at their peak price levels in 2000, still has not produced a positive return today, nearly 24 years later, and this is despite a history of excellent operating income and free cash flow generation over this time frame.
The Cisco Parallel
Going back to 1999 and 2000, Cisco had what seemed like unlimited demand for their routers and network equipment as the backbone of the global Internet was built out. This turned out to be peak optimism and peak bullish sentiment, even though the build-out of the global Internet continued, really unabated.
Conversely, at the depths of the bear market in 2022, I imagined we would get a rally, especially in the downtrodden technology names, I just never imagined it would be this strong, or this persistent, especially in the larger-cap names. After all, large-cap leading technology stocks like JDS Uniphase (“JDSU”), had extraordinary strength too, circa 2000, even after the broader equity market topped in March of 2000. However, this was relatively short-lived.
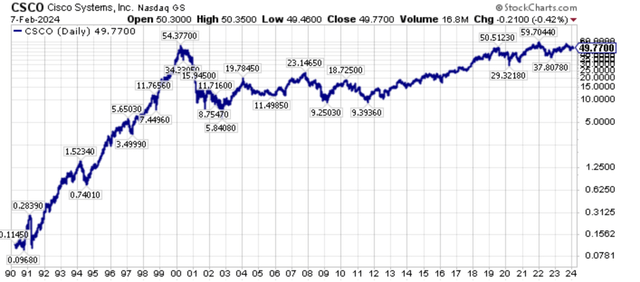
Cisco Systems (CSCO), which in my mind, is a very good comparison for Nvidia (NVDA) today, tumbled far faster than JDSU, and value stocks generally led market strength after the March of 2000 top.
CSCO Long-Term (Author, The Contrarian)
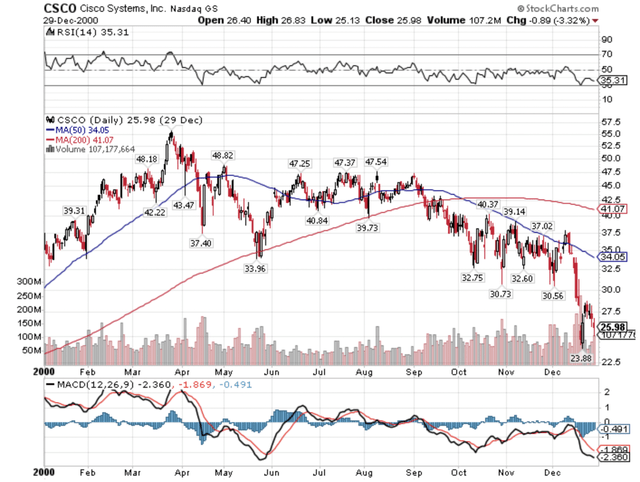
Zooming in closer to Cisco’s 2000 price chart reveals an initial sharp drop, then a recovery. However, by the end of 2000, CSCO shares were roughly half of their earlier 2000 highs.
CSCO Year 2000 Price Chart (Author, The Contrarian)
Then, of course, by 2003, CSCO shares bottomed in the $5 price range, so the lesson here is that even for market leaders with tremendous fundamentals, if the starting valuation is too high, then there can be a sharp drop when the rug is pulled, and extreme bullish investor sentiment turns bearish.
Nvidia Produces A Scarce Commodity Right Now
One of our members had a very interesting observation earlier this morning on something that I didn’t think about this specific way until how it was phrased.
Here is the comment (lightly edited) posted in our Live Chat group on Nvidia.
Hopefulguy Feb 8, 2024
I was talking to my cousin who works in the AI field (Google). He’s a good investor (much more momentum/product focused). While I made a lot of $$ off of Antero Resources (AR) / Peabody Energy (BTU) with this group, he made 7x on Zoom (ZM) and other tech stocks, and he actually fully exited.
Anyway, I was talking to him about Nvidia and how it is so absurdly valued and he said, well isn’t it basically the same as the height of oil scare in 2008. Because GPU supply is extremely limited, especially Nvidia GPUs and no one can increase supply any time soon. Meanwhile, China wants as many as possible due to embargoes and all of cash rich Google (GOOGL), (GOOG), Meta Platforms (META), etc want to make sure they never run out of GPUs for their data center. He said everyone he talks to is afraid that they are going to run out of GPUs. So he said, me, out of all of the people, should understand the “commodity” GPU squeeze, given I went through the nat gas squeeze. Ha.
He did concede that the price-to-sales multipole is absurd, but an interesting perspective to think of GPUs as a scarce “commodity.”…
The takeaway from me here is that it reinforces the notion that Nvidia is going to trade in a boom bust cycle, which is typical for commodities. Right now, we are at the recent peak of the mountain for Nvidia, however, investors need to keep in mind that this is still a cyclical business, the semiconductor business is still a cyclical business, there will be ebbs and flows in the capital expenditure cycle, and the margins Nvidia is commanding right now will attract competition.
Closing Thoughts – Starting Valuation Is Incredibly Important, Caveat Emptor, Buyer Beware
Reiterating the extraordinary numbers, NVDA trades at a price-to-sales multiple of 39 for the trailing twelve months. Using 2024 average revenue estimates of $59 billion for 2024, NVDA trades at a 29 times price-to-sales multiple. Going further, using the 2025 average revenue estimate for NVDA of $94 billion, NVDA trades at roughly 19 times price-to-sales multiple.
Investors are conveniently forgetting that semiconductors are a historically cyclical sector with booms and busts. Witness the disappointing growth forecast, which was below consensus, from Advanced Micro Devices (AMD) after their fourth quarter earnings report. And it is not like NVDA has a ton of cash on the balance sheet, with roughly $18 billion in cash (or approximately $7 per share) against a market capitalization of $1.73 trillion. NVDA actually had a debt of roughly $11 billion at the end of the last quarter, so net cash is even less than initially perceived, not the balance sheet fortress that investors imagine with such a large company by market capitalization.
Yes, NVDA has net cash, but nowhere close to the net cash position that Alphabet (GOOGL, GOOG) or Meta Platforms (META) have on their balance sheets.
Where does NVDA’s share price peak?
Goldman Sachs (GS) recently raised their share price target for Nvidia to $800 per share, calling Nvidia the gold standard of the semiconductor space. The previous gold standard holder in the semiconductor space was Intel (INTC), which has a market capitalization of roughly $181 billion today, a market capitalization that is roughly only 10.4% of Nvidia’s current market capitalization, despite expected 2024 revenues of $57.4 billion, that are actually in-line to slightly below Nvidia’s 2024 expected revenues today.
Yes, Nvidia is going to grow much faster than Intel into 2025, however, the comparability of the size of their revenues today should give investors at least a pause when considering Nvidia’s valuation.
In fact, the average analyst still has a $660 price target for NVDA shares, so many have not caught up to where Goldman Sachs is with their $800 price target. Even at $800 per share, the upside for Goldman’s forecast is estimated at 14%, while an examination of the monthly chart of NVDA shows that corrections from peak to bottom routinely exceed 60% drawdowns, including the 2018 unwind, and the 2021 into 2022 correction.
Remember, those were severe corrections in secular bull markets. The bear case is that a structural bear market in NVDA shares develops, that is a parallel outcome to Cisco System’s shares circa 2000 to 2024, where shares went nowhere from their peak for 24 years, with a 70% drawdown from the top to bottom.
Does that sound like an improbable outcome for NVDA shares today?
If it does, I can guarantee you that Cisco shareholders thought the same thing 24 years ago. The lesson here is that even for a terrific company, and Cisco was a terrifically operated company the last two decades plus, an extremely poor starting valuation, and make no mistake NVDA trades at an obscene starting valuation right now, is almost an impossible hurdle to overcome.
Caveat emptor.
Read the full article here

